Sending Logs from Oracle WebLogic to OpenObserve





Ready to get started?
Try OpenObserve Cloud today for more efficient and performant observability.

What You’ll Learn
This guide shows how to forward logs from Oracle WebLogic Server to OpenObserve using Fluent Bit. You'll learn:
- Why native WebLogic logging falls short for observability
- How to use Fluent Bit to send WebLogic logs to OpenObserve
- How to use VRL (Vector Remap Language) support to cleanly parse and structure the logs for querying, dashboards, and alerting.
What Is Oracle WebLogic?
Oracle WebLogic Server is a Java EE application server used to build, deploy, and run enterprise-level applications. It's widely adopted for hosting large-scale Java applications, offering features like clustering, load balancing, and high availability. WebLogic handles everything from web application delivery to business logic execution, and generates extensive logs capturing server events, deployments, and runtime behaviors.
Oracle WebLogic produces several types of logs that capture different aspects of the application’s behavior. Two common ones are:
| Log Type | Path Examples | Description |
|---|---|---|
| Server Logs | <DOMAIN_HOME>/servers/<server_name>/logs/<server_name>.log |
General runtime logs including startup, shutdown, deployments, and exceptions |
| Access Logs | <DOMAIN_HOME>/servers/<server_name>/logs/access.log (if enabled) |
HTTP request and response logging for web applications |
By default, these logs are written in plain text and are often rotated based on file size or age. For example, a typical log line might look like this:
####<2025-08-04T09:00:00.123+0530> <Error> <Thread-12> <weblogic.servlet.internal.WebAppServletContext> <BEA-000000> <Failed to load class com.example.MyClass>
While these logs are rich in context, they’re often hard to search or extract metrics from.
Why Native WebLogic Logging Falls Short
WebLogic’s logging system was built for manual inspection, not for scalable observability.
You’ll start to quickly reach limitations when you try to:
- Search logs across servers: Without a centralized log store, you’re stuck grepping files one machine at a time.
- Stream logs in real time: WebLogic doesn’t support log streaming natively. Everything is local and delayed.
- Extract structured fields: The logs aren’t in JSON or any structured format. Tools like Fluent Bit or Logstash can’t parse them cleanly without custom logic.
- Trigger alerts based on patterns or volume: WebLogic offers diagnostics via WLDF, but it lacks real-time alerting capabilities based on log content or trends.
These limitations make it difficult to monitor applications effectively, especially at scale.
This is where OpenObserve helps! With Fluent Bit handling collection and OpenObserve providing built-in support for parsing via VRL, you can turn unstructured WebLogic logs into structured, searchable, and actionable data with minimal configuration.
Architecture Overview
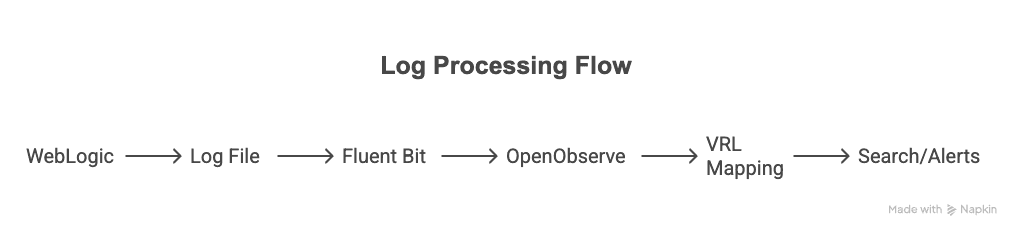
- WebLogic writes logs to a local file (e.g.,
AdminServer.log) - Fluent Bit tails that file and sends it to OpenObserve over HTTP
- OpenObserve uses a VRL mapping rule to parse raw log lines into structured fields
What You’ll Need
- An OpenObserve account (self-hosted or cloud)
- A running Oracle WebLogic Server (AdminServer or ManagedServer)
- Access to its log files (
AdminServer.log, access.log, etc.) - Fluent Bit installed on the WebLogic host (installation guide)
Step 1: Collect Credentials from OpenObserve
Login to your OpenObserve dashboard and collect the following:
Organization: Your organization name.Found in the top-right of your OpenObserve UI

Username/Password: Get your Username, Password and Hostname from the Data Sources page:
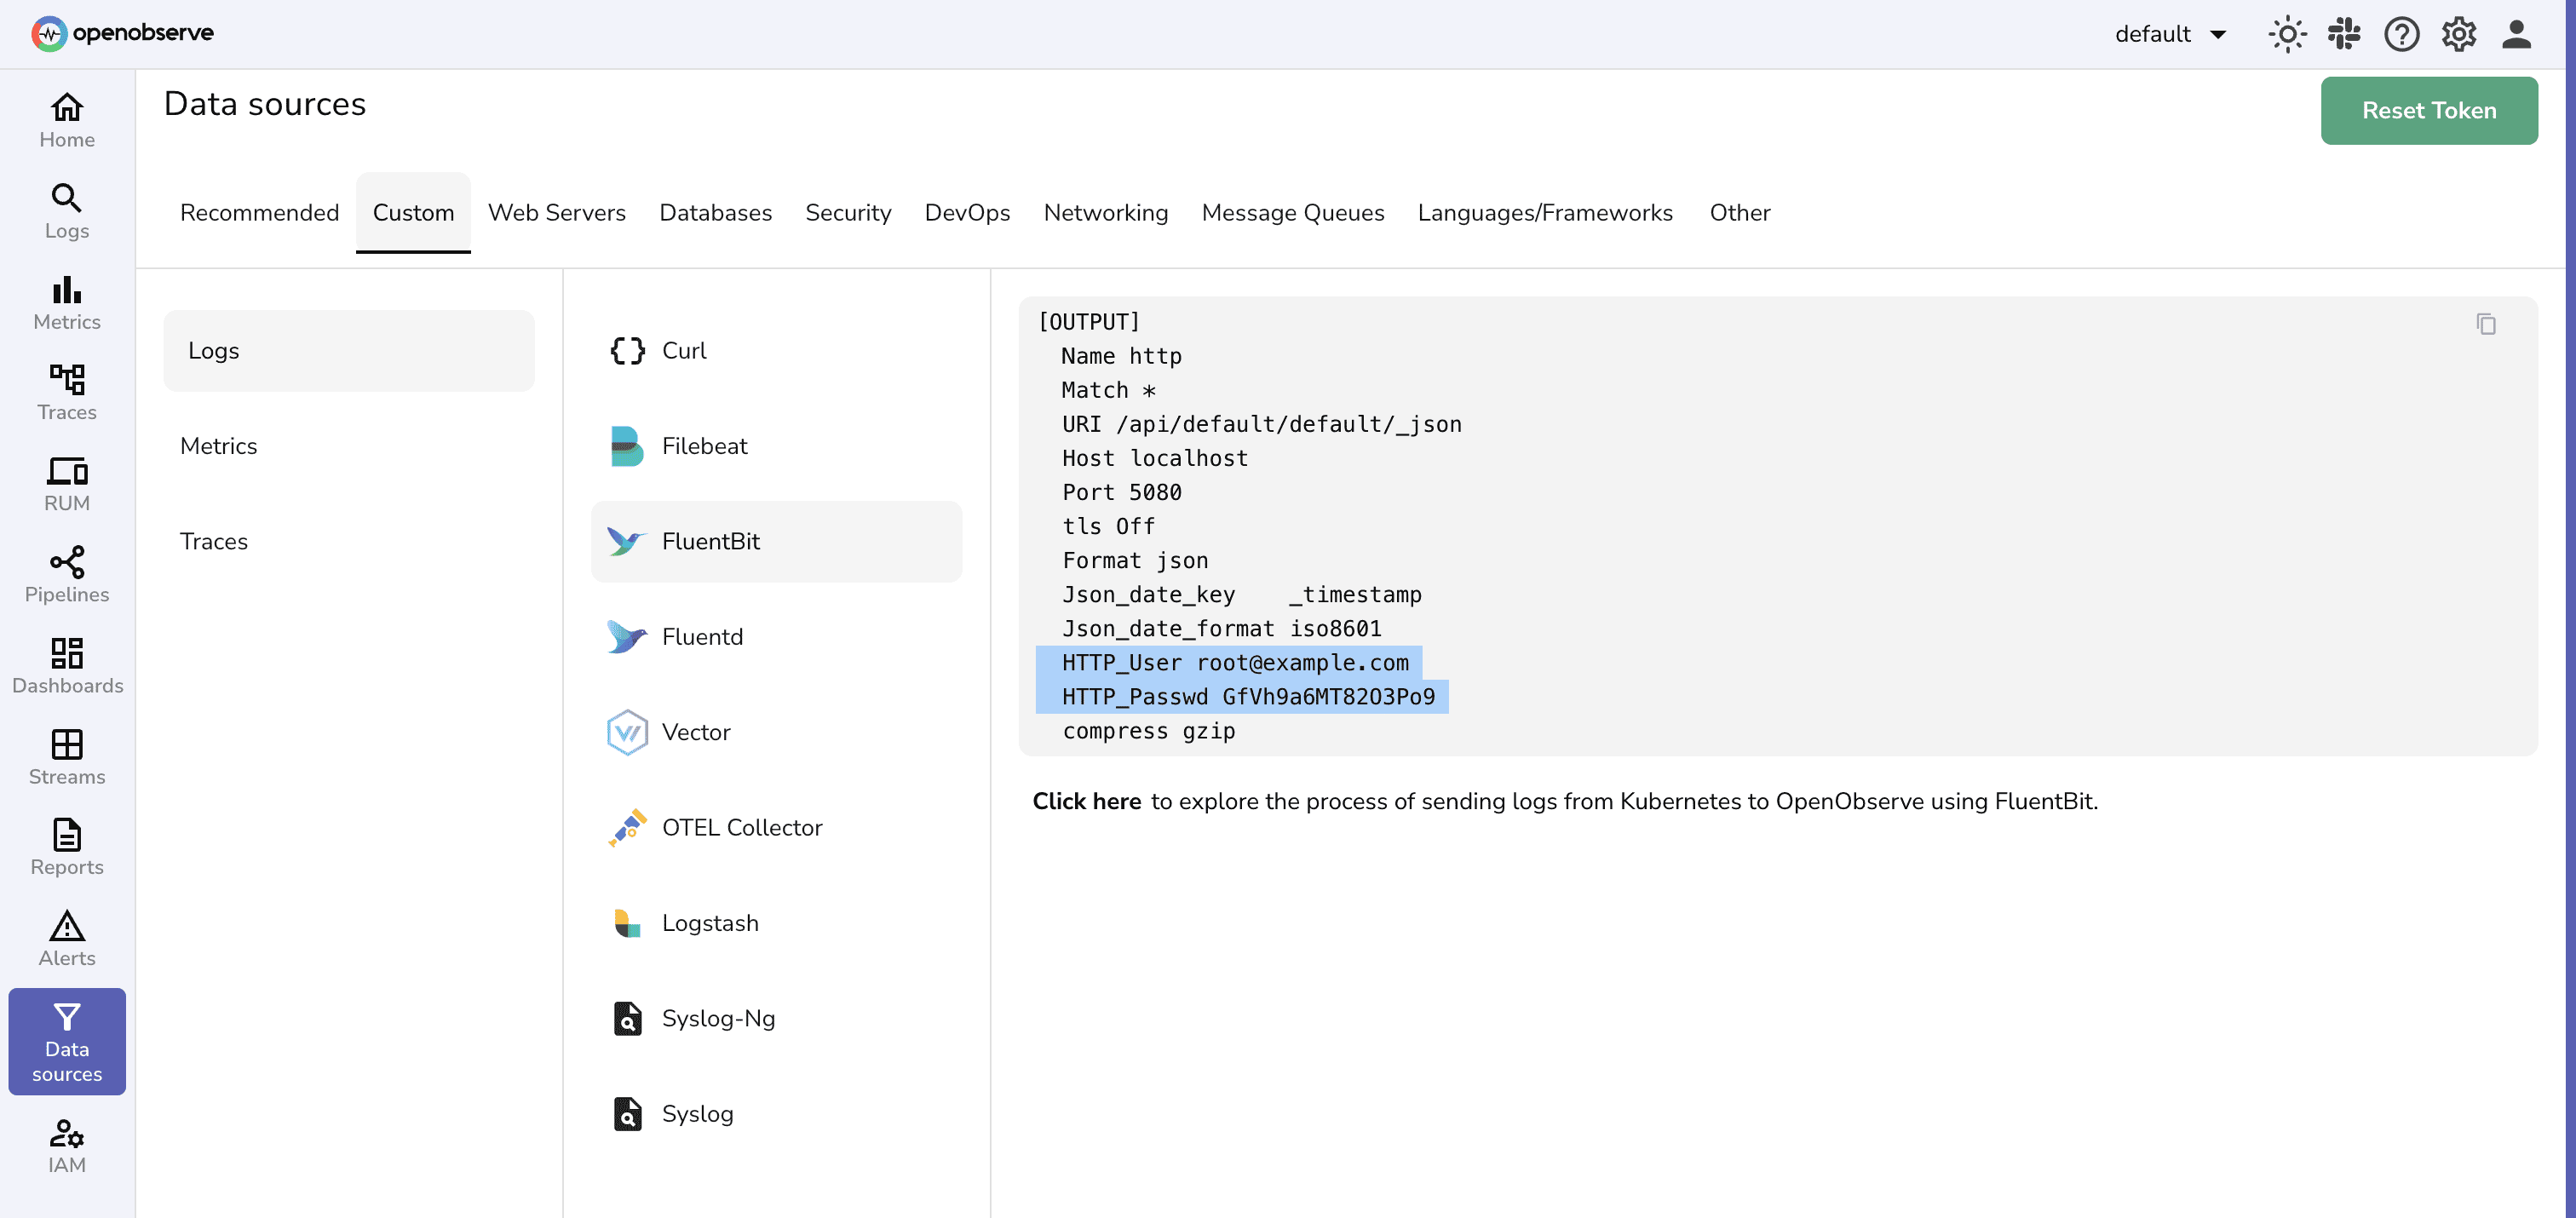 Note: You can copy the entire “output” section. It will be used in Fluent Bit Configuration file.
Step 2: Configure Fluent Bit to Tail WebLogic Logs
Create or modify your Fluent Bit configuration file (e.g.,
/etc/fluent-bit/fluent-bit.conf) with the following:[SERVICE] Flush 5 Log_Level info [INPUT] Name tail Path /opt/weblogic/user_projects/domains/base_domain/servers/AdminServer/logs/AdminServer.log Tag weblogic DB /var/log/flb_adminserver.db [OUTPUT] Name http Match * URI /api/<org_name>/<stream_name>/_json Host <host> Port 5080 tls Off Format json Json_date_key _timestamp Json_date_format iso8601 HTTP_User <openobserve_username> HTTP_Passwd <openobserve_password> compress gzipReplace:
<org_name>: your OpenObserve organization name<stream_name>: desired stream name (e.g.weblogic-logs)<openobserve_username>/<openobserve_password>: your OpenObserve credentials<host>: Openobserve host name
Start Fluent Bit and Forward Logs using:
fluent-bit -c fluent-bit.conf
Trigger log events in WebLogic to test. Fluent Bit should pick them up from the log files and send them to OpenObserve.
Step 3: Verify Logs in OpenObserve
Go to your OpenObserve dashboard and navigate to your stream (e.g.
weblogic-logs)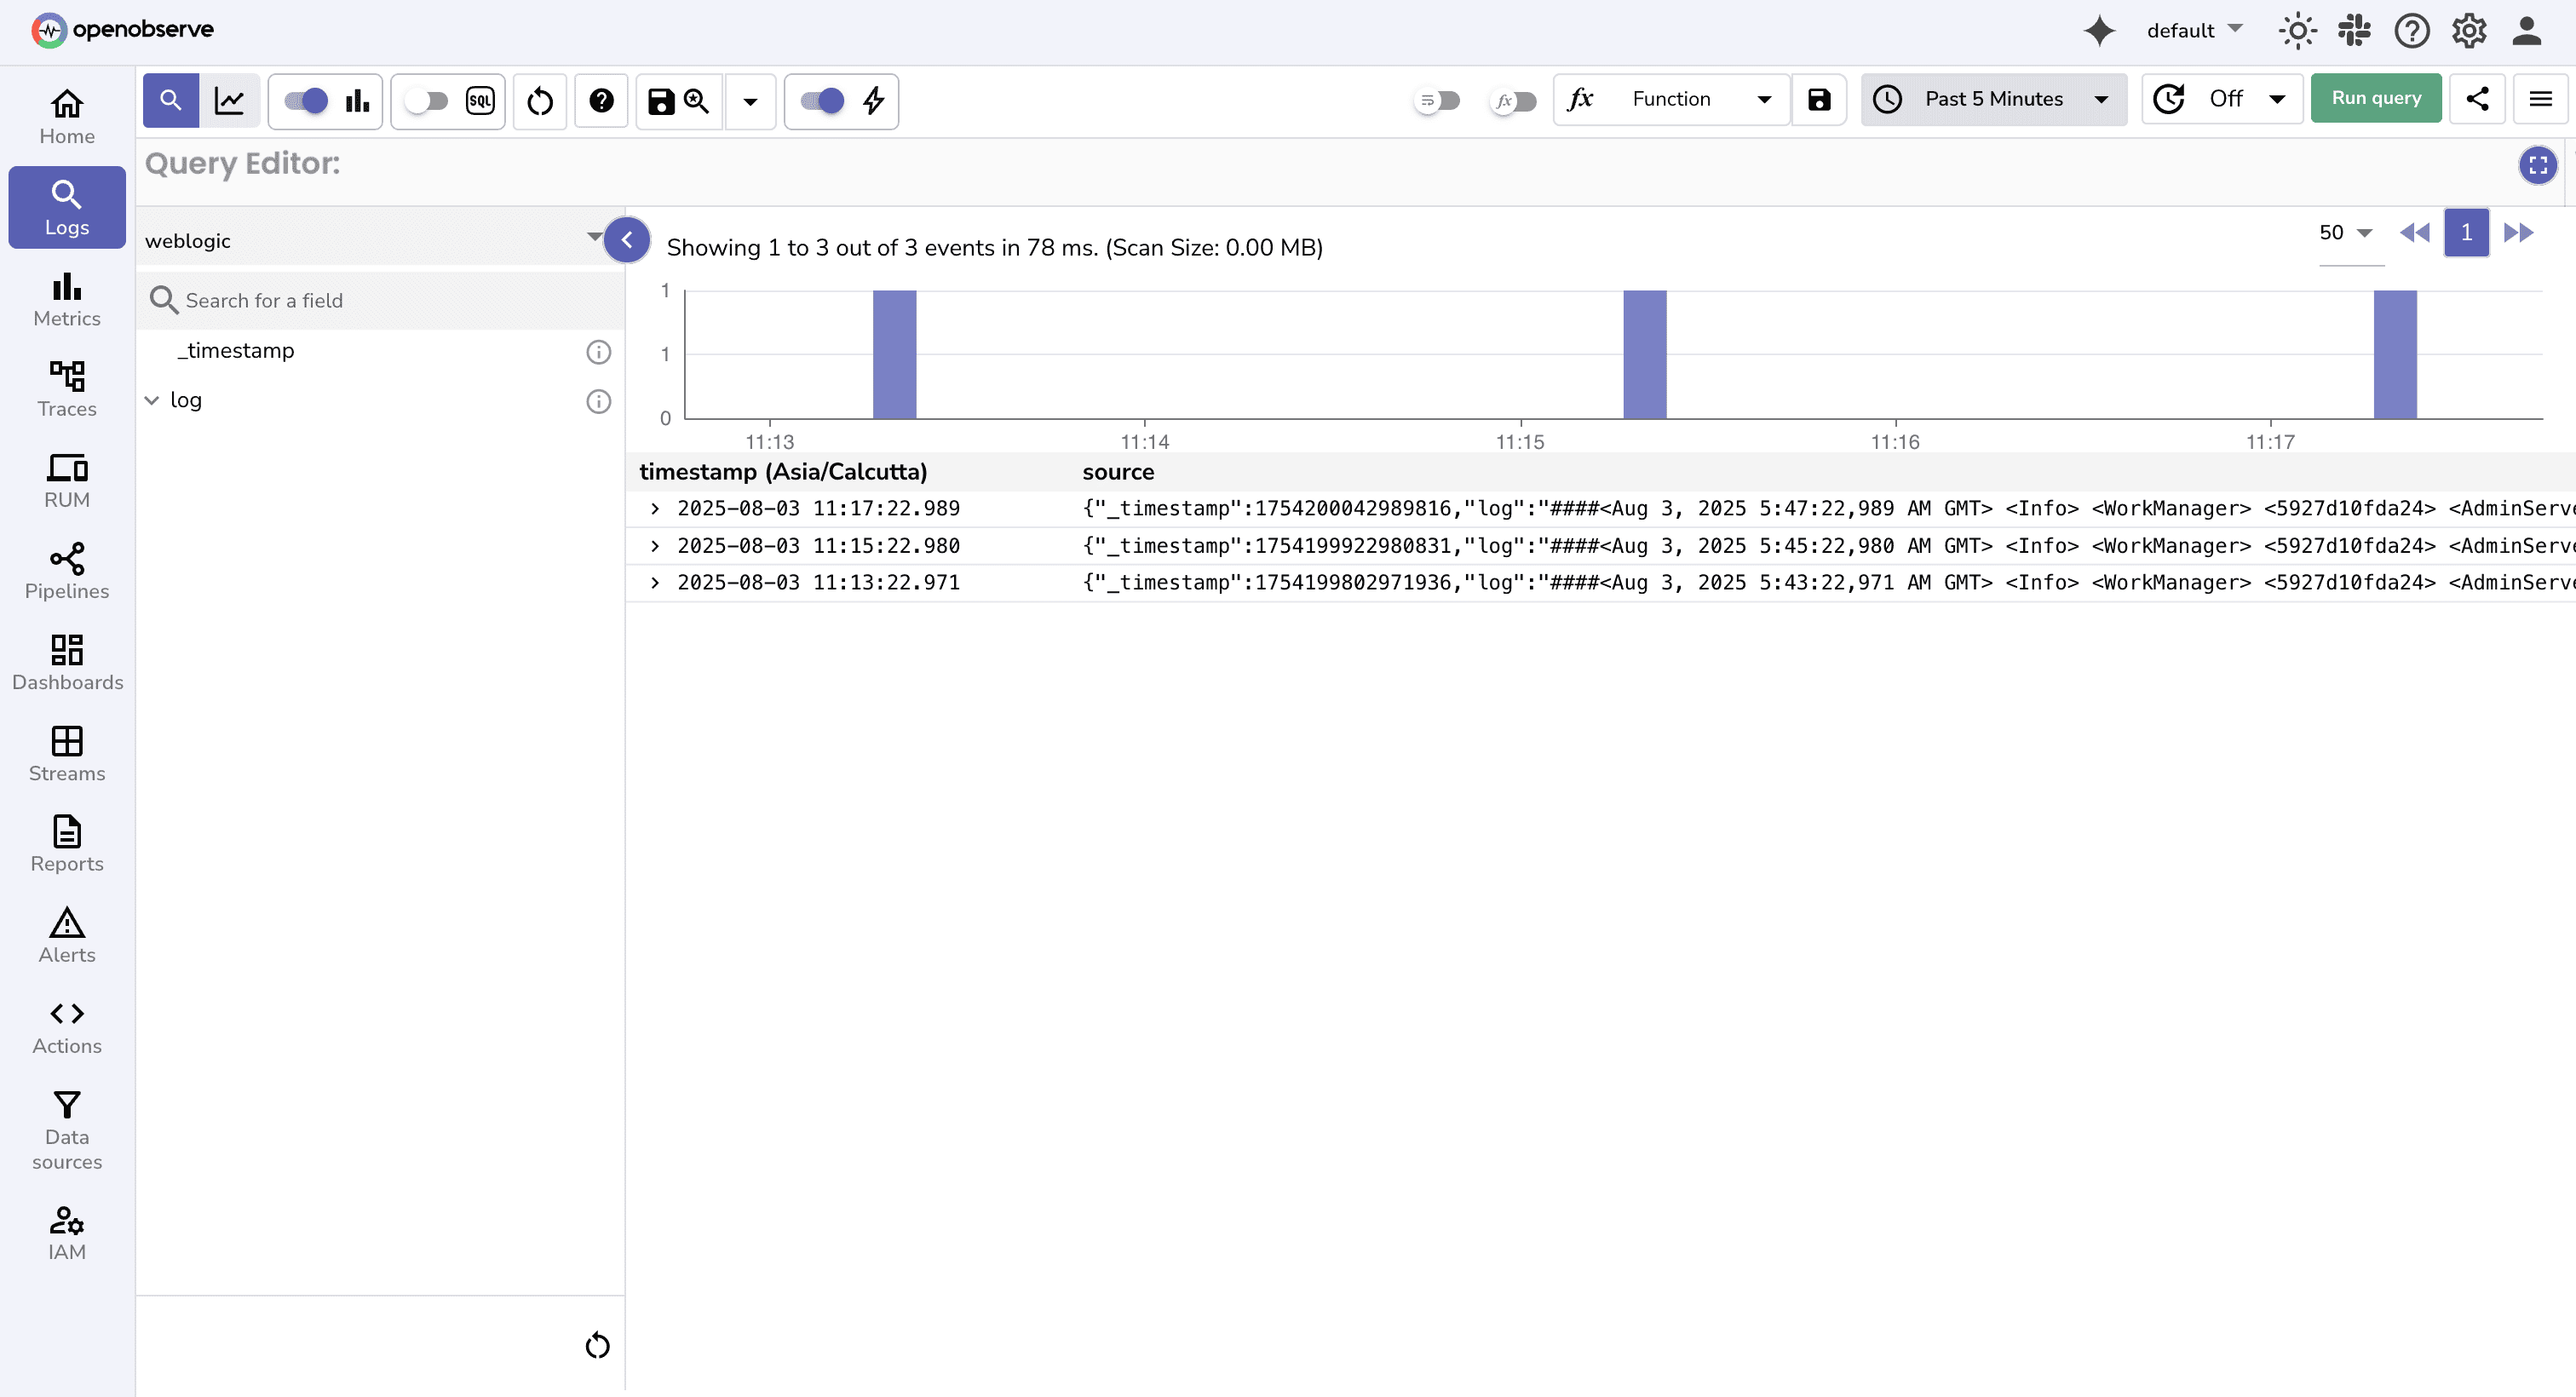
You should see entries like:
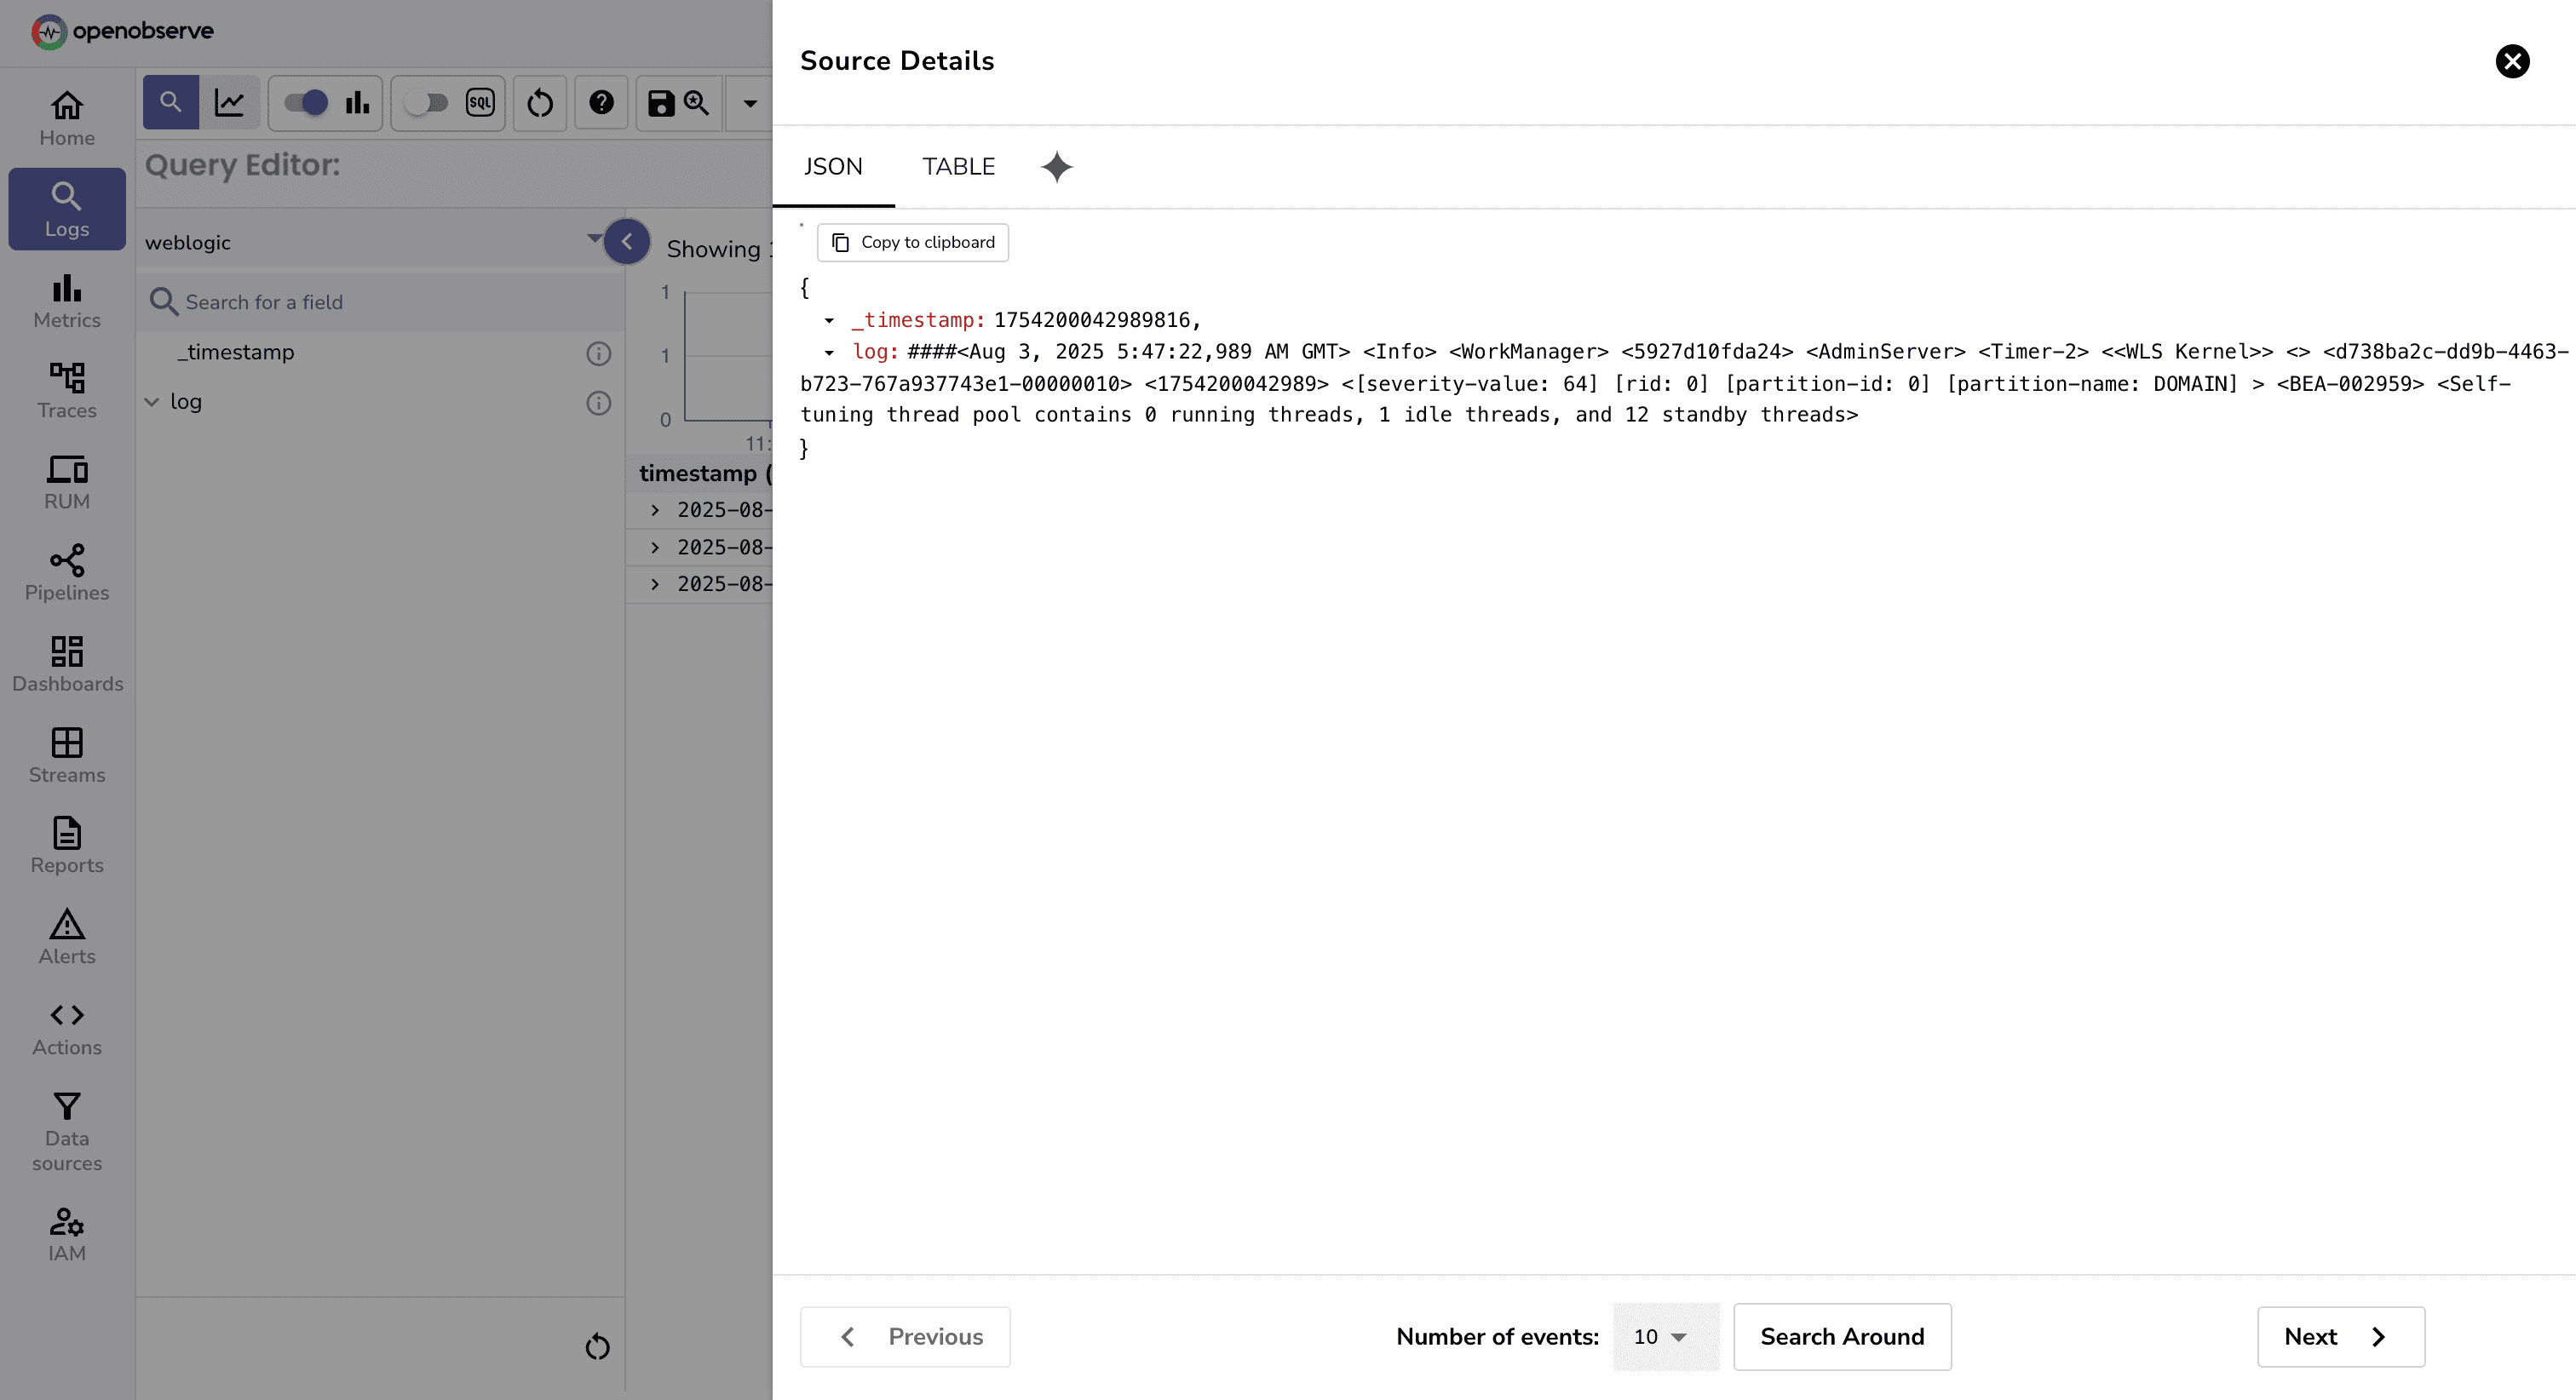
{
  "_timestamp": "XXXXXXX",
  "log": "####<2025-08-04T09:00:00.123+0530> <Error> <Thread-12>    <weblogic.servlet.internal.WebAppServletContext> <BEA-000000> <Failed to load class com.example.MyClass>"
}
Step 4: Parse Logs with VRL Mapping in OpenObserve
Once logs start appearing in OpenObserve, they’ll arrive as raw strings. To make them searchable and usable for alerts or dashboards, we need to extract key fields like timestamp, level, component, and message.
OpenObserve supports VRL (Vector Remap Language) to parse and transform log lines as they are ingested.
Add a VRL Mapping
- Go to Streams → weblogic-logs → Click on “VRL Function Editor”
- Use the following VRL script:
.match = parse_regex!(
 .log,
 r'^####<(?P<timestamp>[^>]+)>\s+<(?P<level>[^>]+)>\s+<(?P<component>[^>]+)>s+(?P<message>.*)$'
)

.level = .match.level
.component = .match.component
.timestamp = .match.timestamp
.message = .match.message
del(.match)
Example Input
####<2025-08-04T09:00:00.123+0530> <Error> <Thread-12> <Failed to load class com.example.MyClass>
Parsed Result
{
  "timestamp": "2025-08-04T09:00:00.123+0530",
  "level": "Error",
  "component": "Thread-12",
  "message": "Failed to load class com.example.MyClass"
}
Similarly, you can extract other useful information.
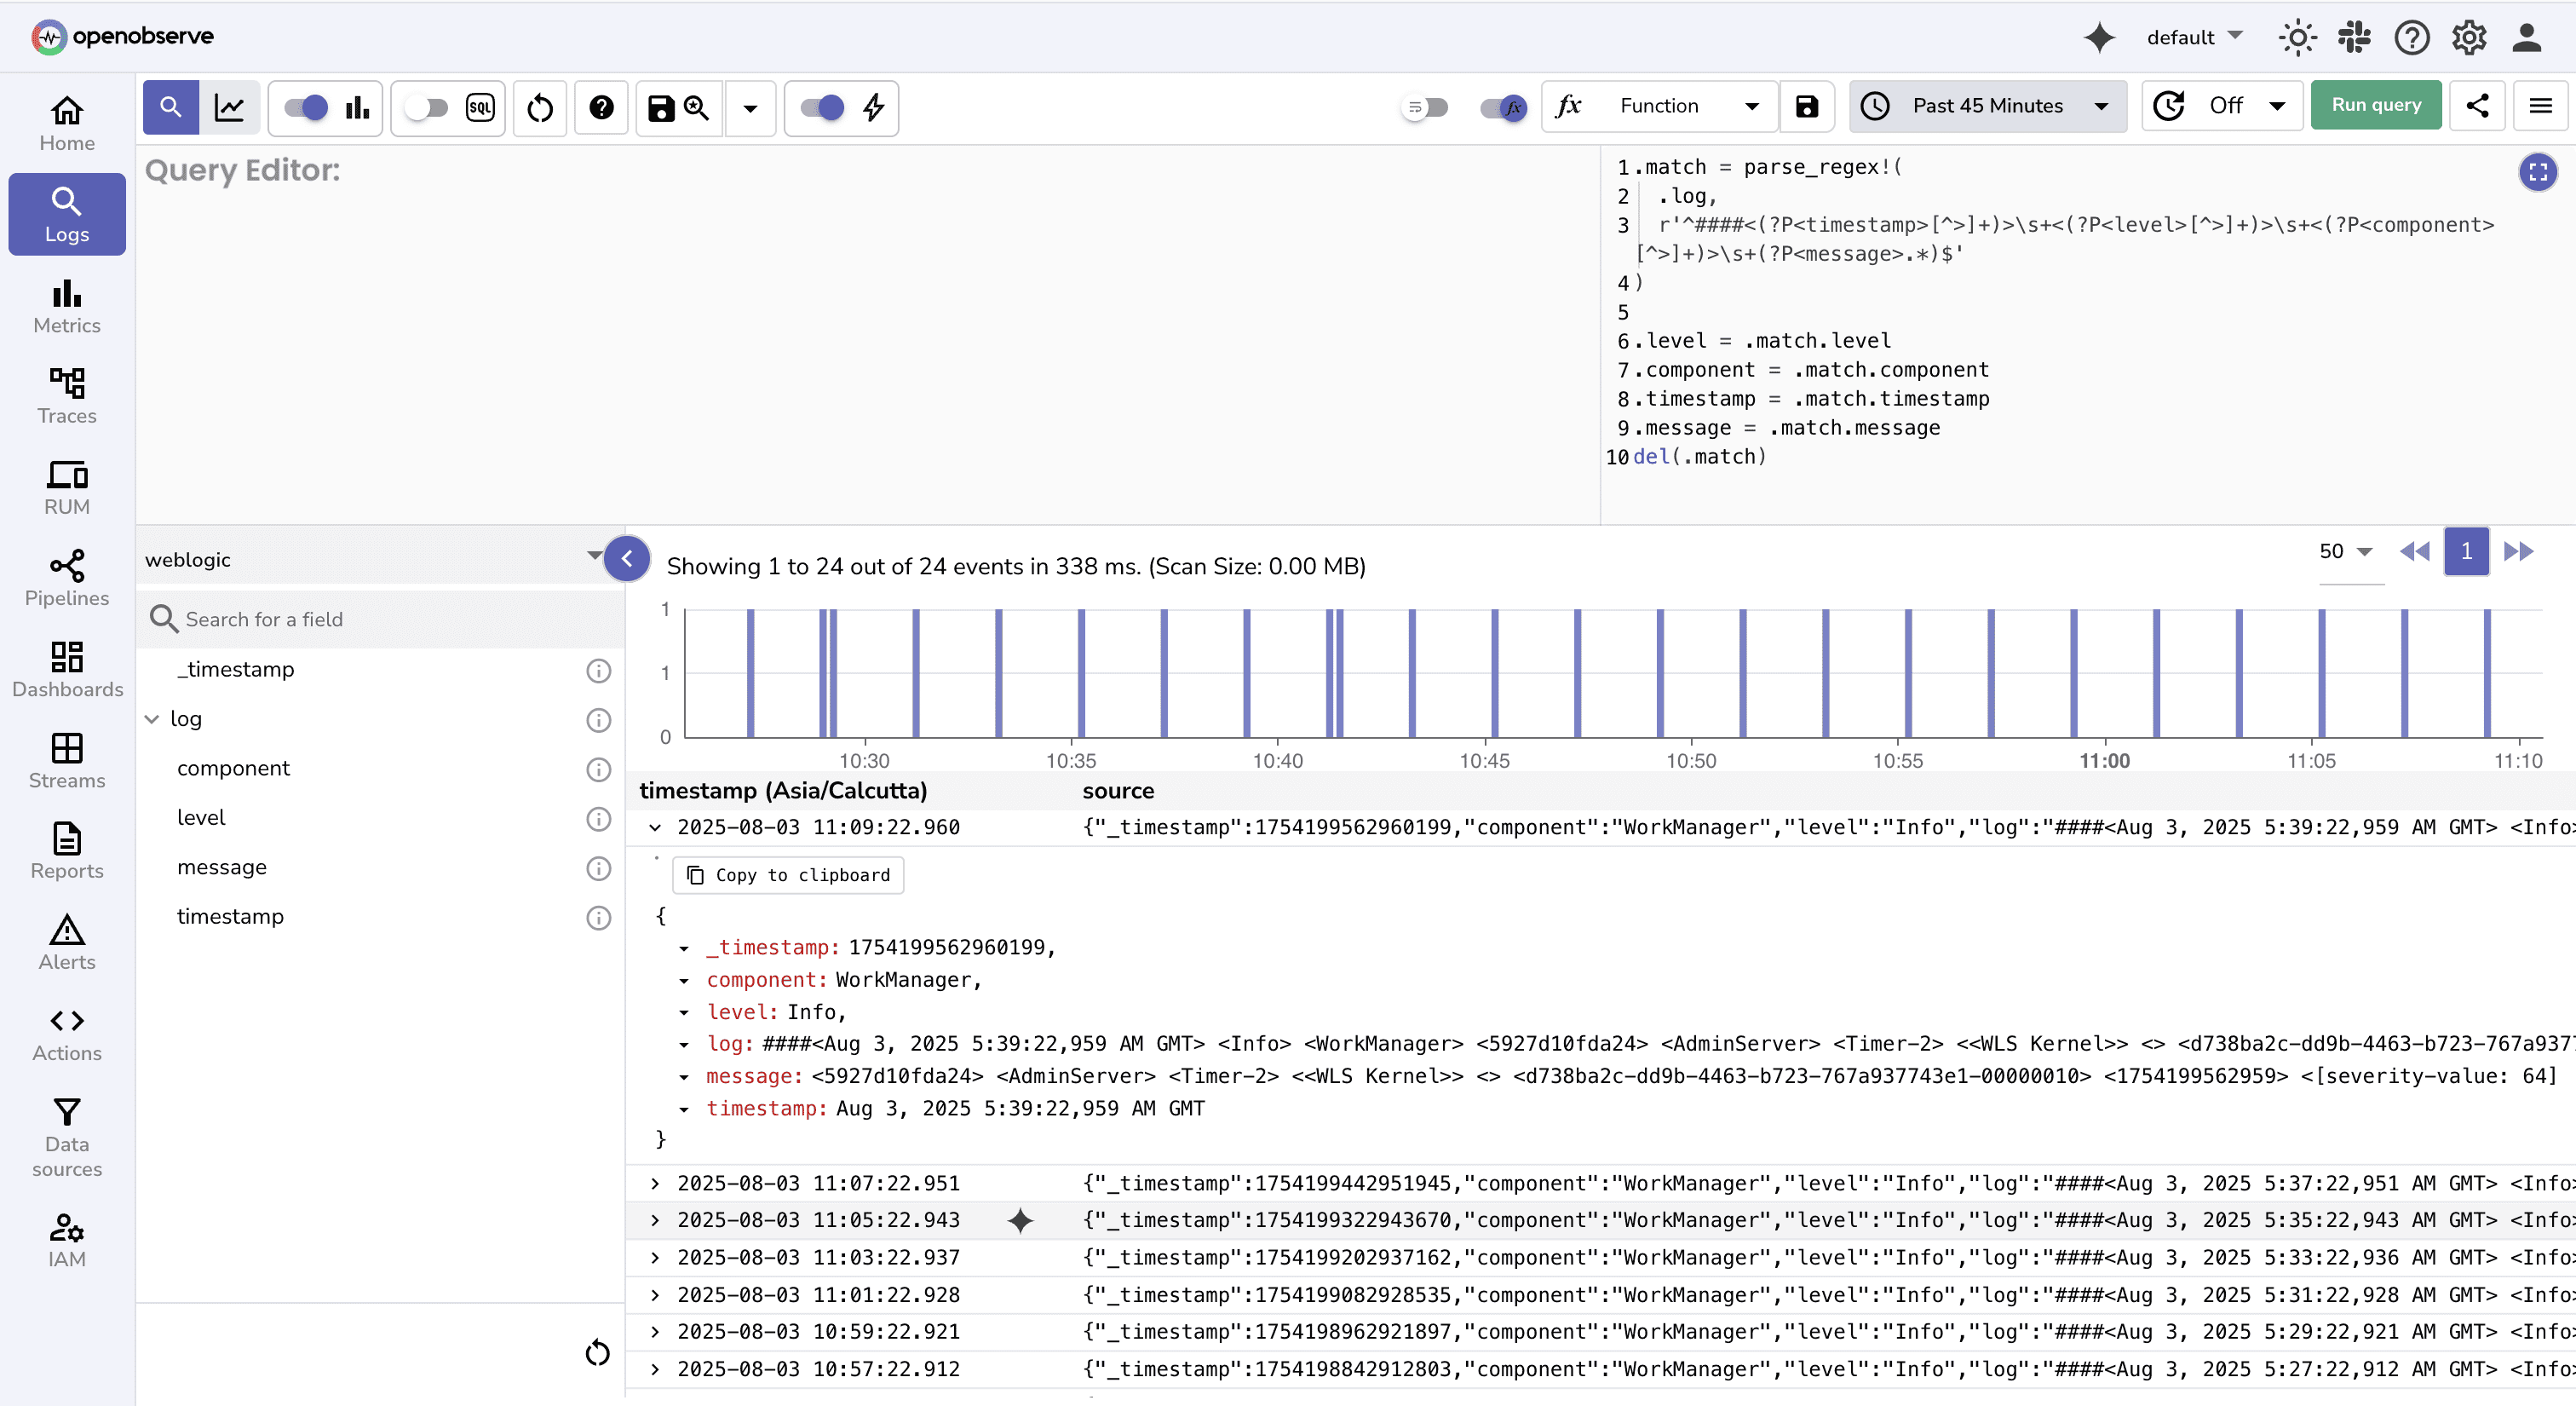
You can now:
- Search for logs by
level,component, or keywords inmessage - Filter or group logs in dashboards
- Set up alerts based on error level or component patterns
Troubleshooting Common Issues
Logs Not Appearing in OpenObserve
- Confirm Fluent Bit is running and not reporting output errors in its logs.
- Ensure the
OPENOBSERVE_STREAMandOPENOBSERVE_ORGvalues exactly match what's configured in OpenObserve. They are case-sensitive. - The output URI in Fluent Bit should follow this pattern:
/api/<org>/<stream>/_json
Logs Arrive but Fields Missing
- VRL Regex Doesn’t Match: If logs appear but fields like level or timestamp are missing, the regex in your VRL script may not match the log structure.
Other Issues:
- Use
cURLto Isolate Issues: Before debugging Fluent Bit further, use a manual curl request to confirm OpenObserve ingestion works:
curl -X POST \ -H "Authorization: Basic <AUTH_KEY>" \ -H "Content-Type: application/json" \ -d '[{"log": "test log"}]' \ https://<OPENOBSERVE_HOST>/api/<ORG>/<STREAM>/_json- Use
Conclusion
By streaming WebLogic logs into OpenObserve, you're no longer limited by legacy log viewers or local file-based troubleshooting. This setup supports:
- Fast, scalable search across large volumes of WebLogic logs
- Structured logging with VRL pipelines for easy filtering and correlation
- Longer retention without the high storage costs of traditional logging systems
- Unified observability by bringing logs, metrics, and traces into a single platform
Next Steps
- Search and Filter Logs: Use OpenObserve's powerful search syntax to filter by
level,component, and more. - Customize Your VRL Pipeline: Add more fields like thread ID, class name, or error codes using OpenObserve's Vector Remap Language.
- Build Dashboards: Create real-time visualizations for error rates, throughput, or slow components.
- Configure Alerts: Trigger alerts based on log patterns, thresholds, etc.
As you can see, OpenObserve makes it simple to parse, search, and act on your log data.
- Get started with an OpenObserve Cloud 14-day free trial
- Get a better understanding of the platform with an OpenObserve Demo
- Learn more about log pipelines
Get started today and experience the power of OSS log observability that doesn’t break the bank.
About the Authors
Simran Kumari

Passionate about observability, AI systems, and cloud-native tools. All in on DevOps and improving the developer experience.
Chaitanya Sistla
Chaitanya Sistla is a Principal Solutions Architect with 17X certifications across Cloud, Data, DevOps, and Cybersecurity. Leveraging extensive startup experience and a focus on MLOps, Chaitanya excels at designing scalable, innovative solutions that drive operational excellence and business transformation.
Follow OpenObserve on Google
Add OpenObserve as a preferred source to see more of our articles in Google Search and Top Stories.











