How to Ingest and Analyze NATS Logs and Metrics for Better Observability




Ready to get started?
Try OpenObserve Cloud today for more efficient and performant observability.
Why Monitor NATS Logs and Metrics?
NATS is a high-performance, cloud-native messaging system designed for distributed applications, microservices, and IoT systems. As NATS plays a crucial role in ensuring seamless communication between services, monitoring its logs and metrics is essential for various reasons:
- Performance Optimization: Monitoring logs and metrics helps in identifying bottlenecks and tuning message throughput.
- Troubleshooting: Logs provide insights into connection failures, dropped messages, and authentication issues, while metrics track system health and resource utilization.
- Security Compliance: Keeping track of logs helps detect unauthorized access and potential security threats.
- Operational Visibility: Logs help in understanding system behavior, debugging issues, and ensuring reliability, while metrics provide a quantitative overview of the system's performance.
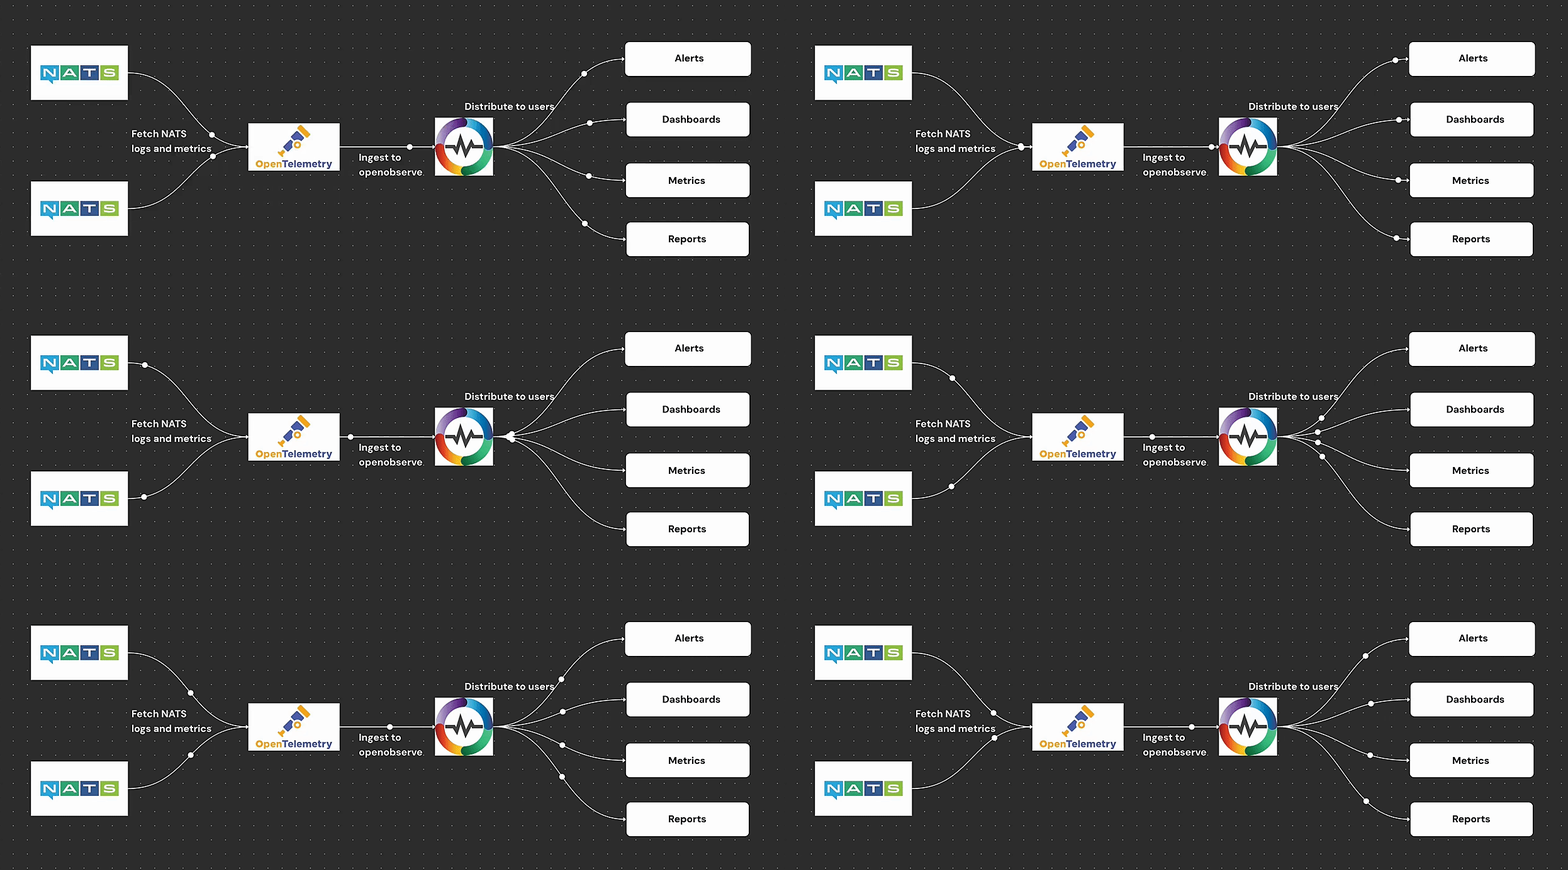
Without proper logging and monitoring, organizations risk undetected failures, slow response times, and security vulnerabilities in their NATS deployments. OpenObserve provides a centralized logging and metrics platform that makes it easier to collect, analyze, and visualize NATS logs and metrics for real-time observability.
Prerequisites
- Ubuntu machine
- Docker installed
- Active OpenObserve Account
- Understanding of prometheus exporter
1. Setting Up NATS on Ubuntu
To get started, we will install and run a NATS server on an Ubuntu system.
Step 1: Install System Dependencies
sudo apt update && sudo apt upgrade -y
sudo apt install -y wget unzip
Step 2: Download and Install NATS Server
wget https://github.com/nats-io/nats-server/releases/download/v2.10.26/nats-server-v2.10.26-linux-amd64.zip
unzip nats-server-v2.10.26-linux-amd64.zip
cd nats-server-v2.10.26-linux-amd64
sudo mv nats-server /usr/local/bin/
Step 3: Start the NATS Server
nats-server -js
The -js flag enables JetStream, which provides message persistence and stream processing capabilities.
2. Configuring NATS Logging and Metrics
By default, NATS logs events to stdout, but we can configure it to log to a file for better observability. Additionally, we will enable metrics using the Prometheus NATS exporter.
Step 1: Create a Configuration File
sudo mkdir -p /etc/nats
sudo nano /etc/nats/nats.conf
Add the following configuration:
pid_file: "/var/run/nats-server.pid"
http: 8222

log_file: "/var/log/nats-server.log"
logtime: true
debug: true
trace: true
This configuration ensures that:
- Logs are stored in /var/log/nats-server.log
- Log timestamps are enabled
- Debug and trace logging are turned on for detailed insights
Step 2: Start NATS with the Config File
nats-server -c /etc/nats/nats.conf
To verify logs are being generated:
tail -f /var/log/nats-server.log
Step 3: Enable NATS Metrics using Prometheus Exporter
Run the following command to start the Prometheus NATS exporter:
docker run -p 7777:7777 natsio/prometheus-nats-exporter:latest -D -jsz=all -accstatz -connz_detailed -gatewayz -healthz -connz -varz -channelz -serverz -subz http://<NATS_SERVER_IP>:8222
This will expose NATS metrics on port 7777.
3. Forwarding NATS Logs and Metrics to OpenObserve Using OpenTelemetry Collector
To collect and publish both logs and metrics to OpenObserve, we will use the OpenTelemetry (OTEL) Collector.
Step 1: Install OpenTelemetry Collector
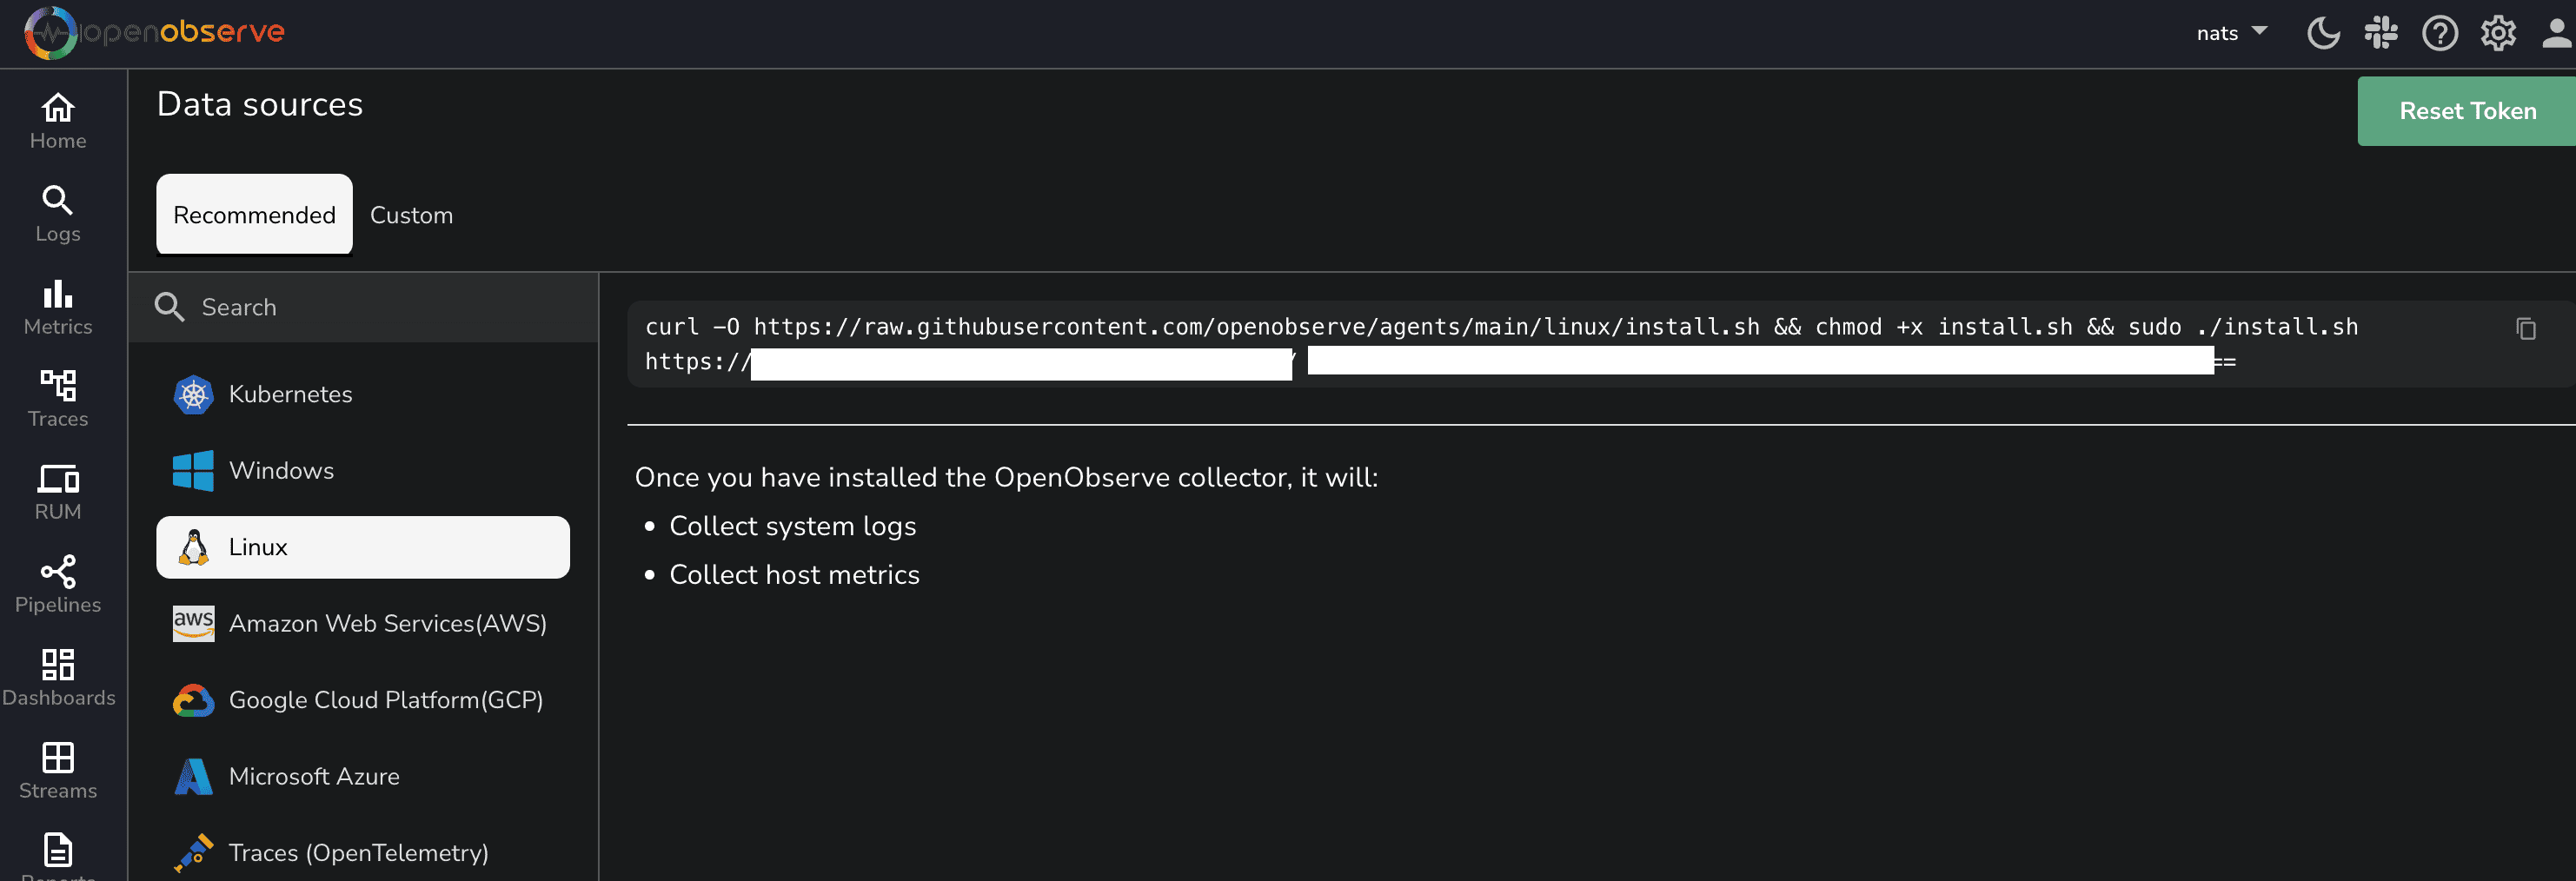
curl -O https://raw.githubusercontent.com/openobserve/agents/main/linux/install.sh && chmod +x install.sh && sudo ./install.sh OPENOBSERVE_HTTP_ENDPOINT OPENOBSERVE_TOKEN
You can find the above details from OpenObserve datasources page as shown below.
Step 2: Configure OpenTelemetry Collector
Create a configuration file:
sudo vi /etc/otelcol-config.yaml
Add the following configuration:
receivers:
  filelog/std:
    include: [/var/log/nats-server.log]
    start_at: beginning
  prometheus:
    config:
      scrape_configs:
        - job_name: "nats"
          scrape_interval: 5s
          static_configs:
            - targets: ["localhost:7777"]
processors:
  batch:
    timeout: 5s

exporters:
  otlphttp/openobserve:
    endpoint: OPENOBSERVE_ENDPOINT
    headers:
      Authorization: "OPENOBSERVE_TOKEN"
      stream-name: nats

service:
  pipelines:
    metrics:
      receivers: [prometheus]
      processors: [batch]
      exporters: [otlphttp/openobserve]
    logs:
      receivers: [filelog/std]
      processors: [batch]
      exporters: [otlphttp/openobserve]
- Replace
`with your OpenObserve authentication token. - Replace
`with your OpenObserve endpoint listed in datasources page.
Step 3: Restart OpenTelemetry Collector
systemctl restart otel-collector
To verify logs and metrics are being sent:
journalctl -u otelcol -f
4. Load Testing NATS with nats bench
To generate traffic for NATS, run the following command:
nats bench test --pub 10 --sub 10 --msgs 1000000 --size 128
This will:
- Use 10 concurrent publishers
- Use 10 concurrent subscribers
- Send 1,000,000 messages
- Set the message size to 128 bytes
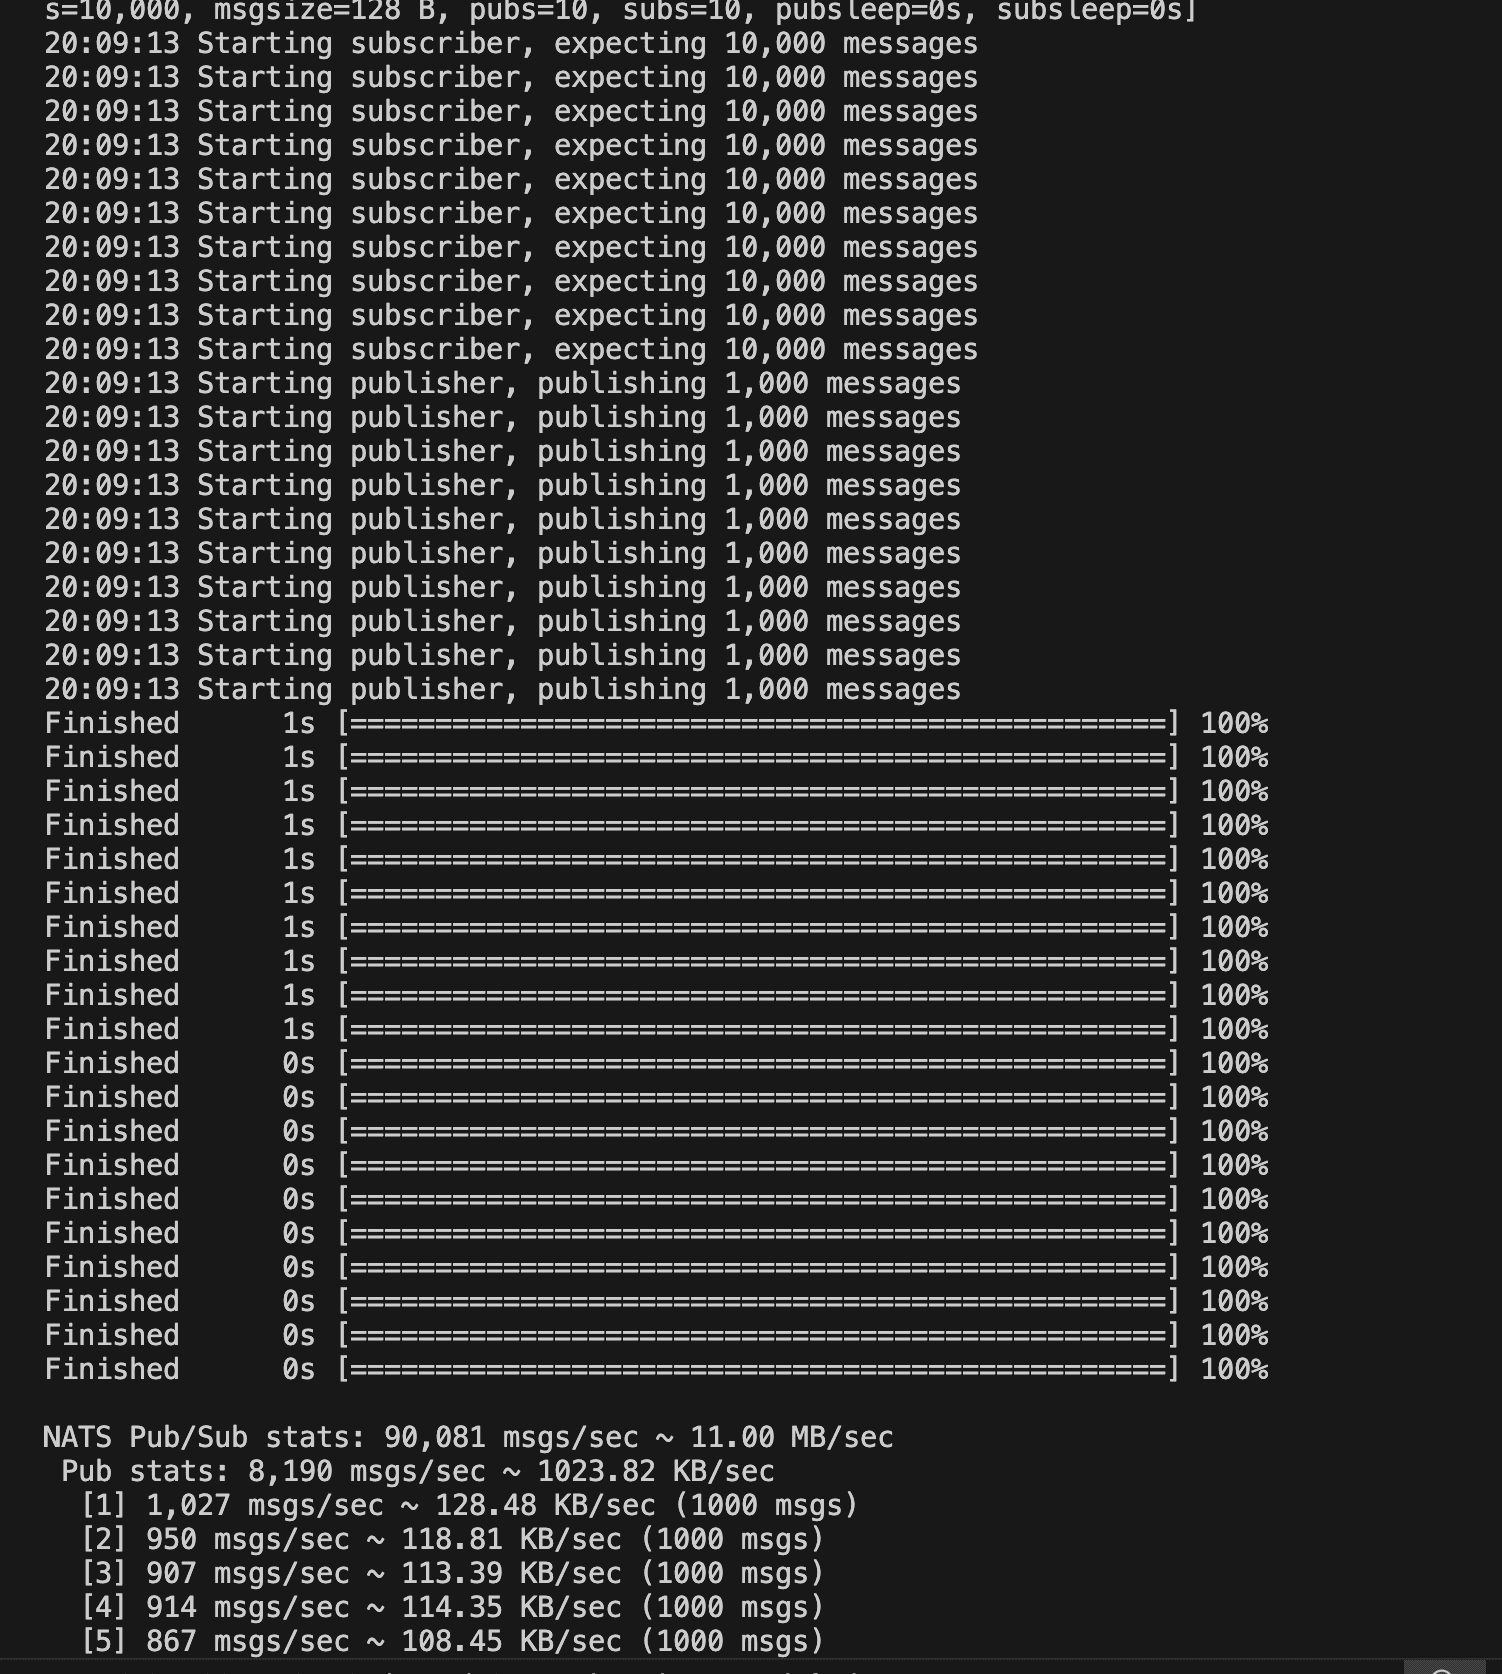 This benchmark tool helps simulate real-world traffic and measure NATS performance.
5. Visualizing NATS Logs and Metrics in OpenObserve
Once logs and metrics are flowing into OpenObserve, we can query and visualize them.
Step 1: Log in to OpenObserve
- Navigate to OpenObserve
- Select the default organization (or your specific organization)
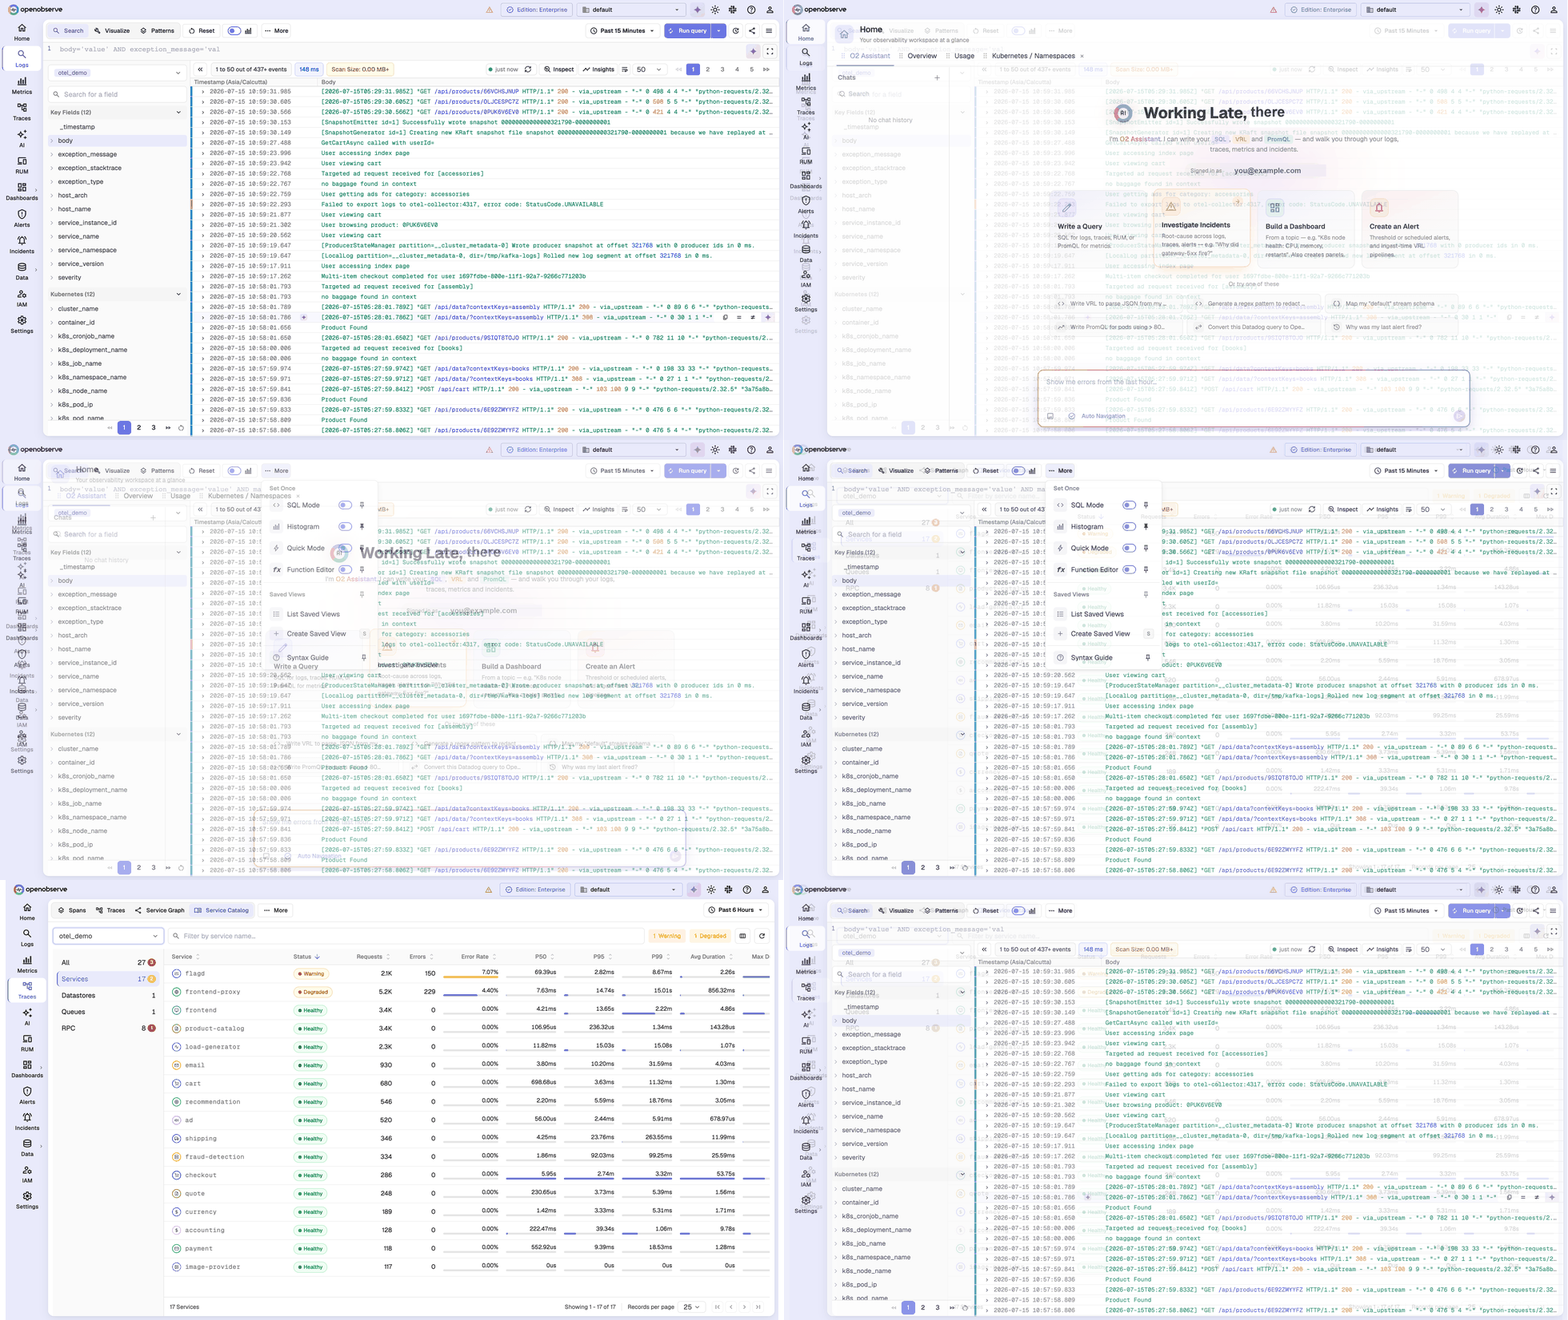
- Select the logs to explore all the logs that were ingsted.
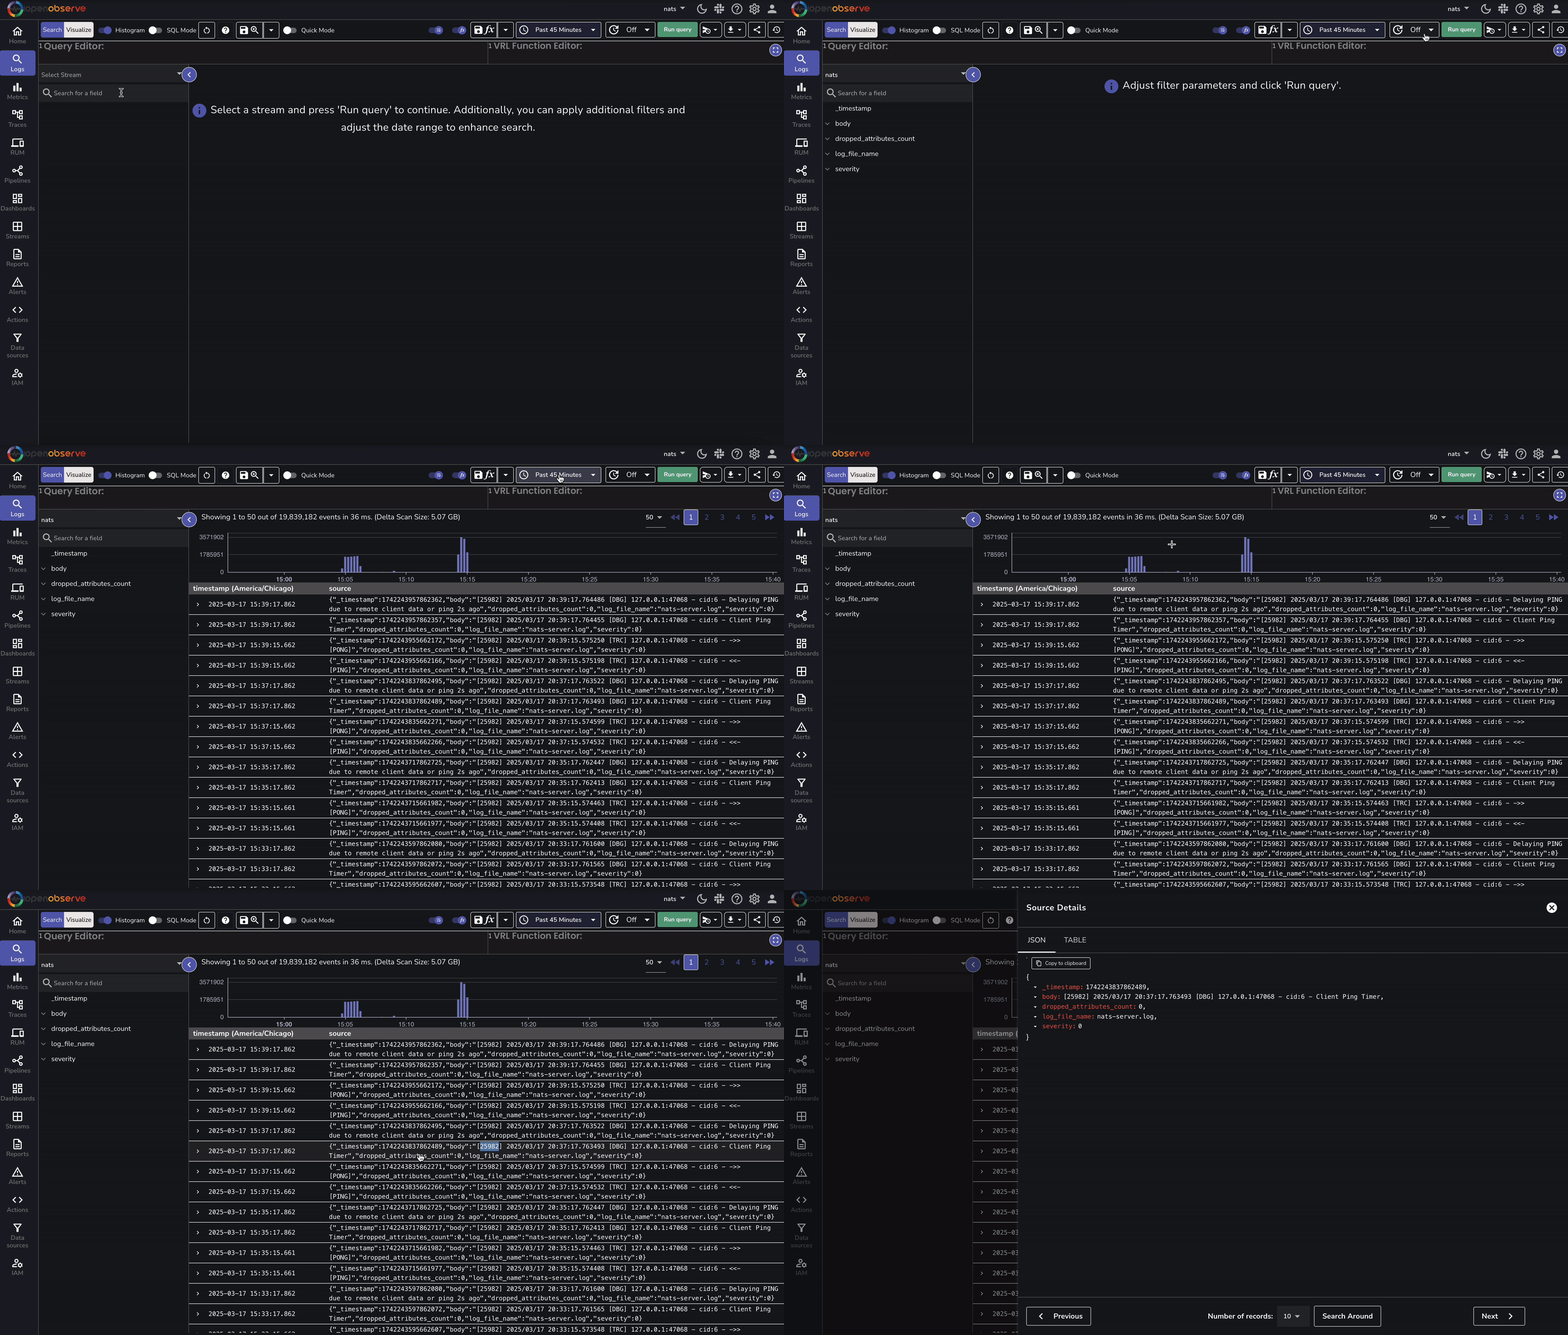
Step 2: Use the NATS Metrics Dashboard
A pre-configured dashboard is available to visualize real-time logs and metrics. This dashboard provides:
- Message throughput
- Connection statistics
- Error rates
- Performance trends
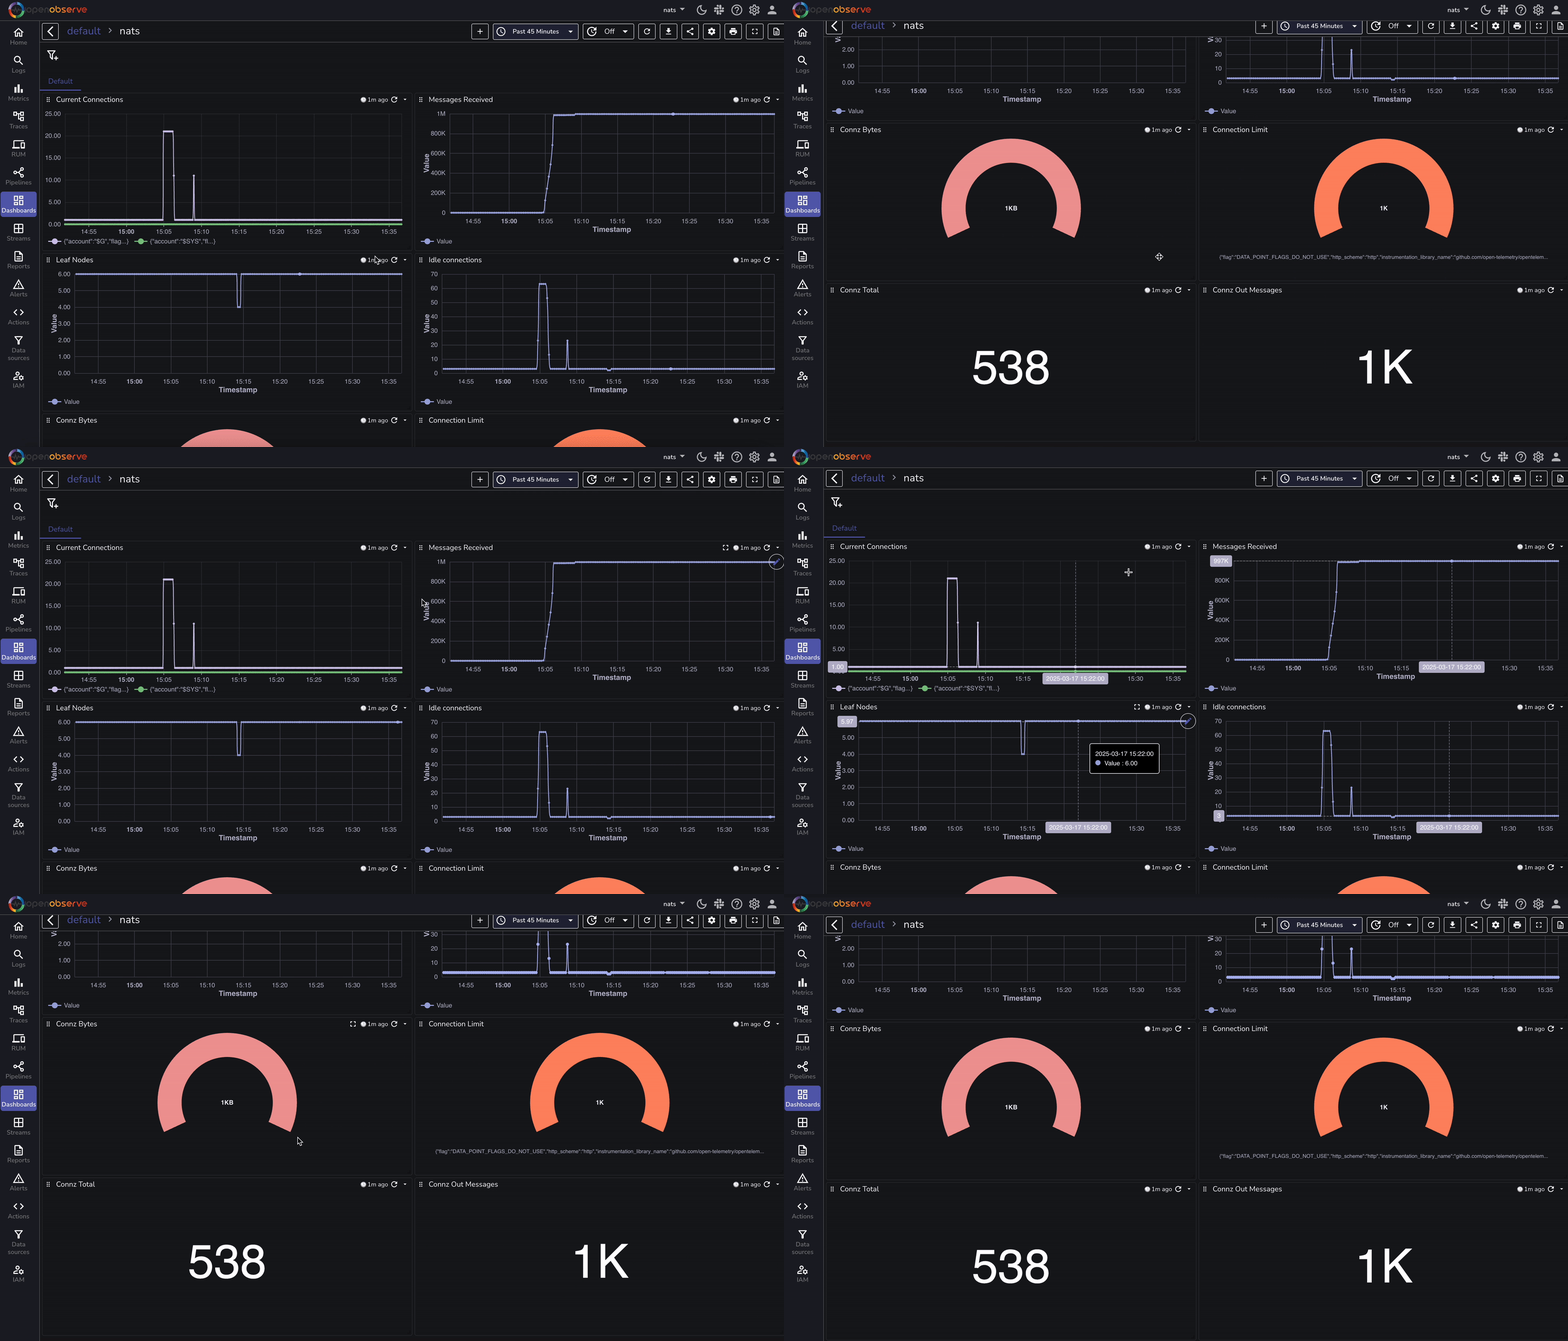
This dashboard can be imported into OpenObserve for immediate insights into your NATS deployment.
Detailed Comparision of monitoring before and after OpenObserve
Here's a detailed comparison for monitoring NATS without OpenObserve vs. with OpenObserve:
| Feature | Without OpenObserve | With OpenObserve |
|---|---|---|
| Log Collection | Requires setting up a custom logging mechanism | Logs are collected using OpenTelemetry (OTEL) Collector |
| Log Storage | Logs stored in local files or separate logging system | Centralized log storage in OpenObserve |
| Log Search & Analysis | Manual searching through logs, difficult correlation | Fast, full-text search with query capabilities |
| Metric Collection | Requires Prometheus setup and additional exporters | Metrics collected via OTEL collector with built-in support |
| Metric Visualization | Requires setting up Grafana and custom dashboards | Prebuilt OpenObserve dashboards for NATS |
| Alerting & Notifications | Requires separate alerting tools (e.g., Prometheus Alertmanager) | Built-in alerting with custom thresholds and notifications |
| Log & Metric Correlation | Logs and metrics stored separately, requiring manual correlation | Unified view for logs, metrics, and traces in OpenObserve |
| Data Retention | Limited by local storage constraints | Scalable storage with retention policies in OpenObserve |
| Query & Insights | Complex queries require additional tools | SQL-like queries for deep insights |
| Scalability | Requires managing storage and scaling manually | OpenObserve scales automatically for large workloads |
This table highlights how OpenObserve simplifies and enhances NATS monitoring by integrating logs, metrics, and tracing into a single, scalable platform.
Conclusion
By integrating NATS logs and metrics with OpenObserve via OpenTelemetry, you gain:
- Real-time visibility into messaging activity and system performance.
- Faster troubleshooting with structured log and metric analysis.
- Improved security and compliance by monitoring access patterns and anomalies.
Get Started with OpenObserve Today!
Sign up for a free trial of OpenObserve on our website. Check out our GitHub repository for self-hosting and contribution opportunities.
About the Author
Chaitanya Sistla

Chaitanya Sistla is a Principal Solutions Architect with 17X certifications across Cloud, Data, DevOps, and Cybersecurity. Leveraging extensive startup experience and a focus on MLOps, Chaitanya excels at designing scalable, innovative solutions that drive operational excellence and business transformation.