Monitoring GitHub Metrics in Real-Time with OpenTelemetry and OpenObserve




Ready to get started?
Try OpenObserve Cloud today for more efficient and performant observability.
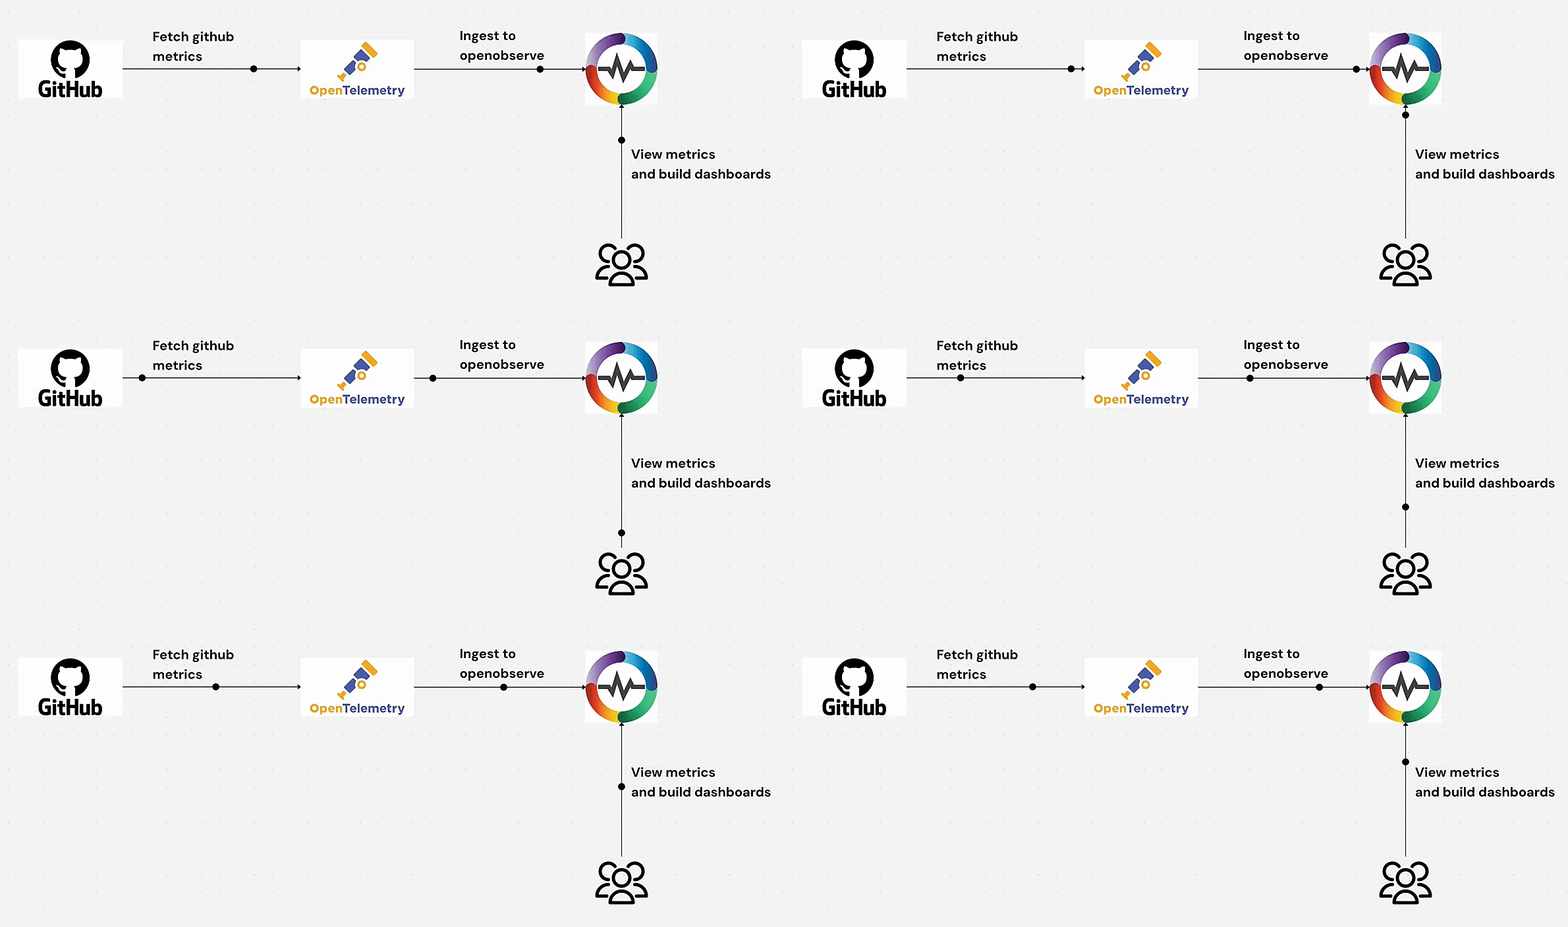
Are you looking to gain deeper insights into your GitHub repository activities? In this comprehensive guide, we'll walk through how to set up an end-to-end monitoring solution using OpenTelemetry Collector and OpenObserve to track GitHub metrics for better development analytics.
Introduction
Software development teams rely heavily on GitHub for version control and collaboration. But how do you monitor and analyze GitHub activities across your organization effectively? This is where OpenTelemetry and OpenObserve come in.
In this tutorial, we'll demonstrate how to:
- Install and configure OpenTelemetry Collector Contrib
- Set up GitHub metrics collection
- Export the data to OpenObserve
- Visualize your GitHub metrics with pre-built dashboards
This solution provides real-time monitoring of your GitHub repositories, including private repos and PR activities - giving you valuable insights into your development workflow.
Prerequisites
- Linux server (Ubuntu/Debian-based for this tutorial)
- GitHub Personal Access Token (PAT) with appropriate permissions
- OpenObserve account and API token
- Sudo access on your server
Step 1: Install OpenTelemetry Collector Contrib
The first step is to install the OpenTelemetry Collector Contrib package, which includes the GitHub receiver:
wget https://github.com/open-telemetry/opentelemetry-collector-releases/releases/download/v0.123.1/otelcol-contrib_0.123.1_linux_amd64.deb
sudo dpkg -i otelcol-contrib_0.123.1_linux_amd64.deb
This installs the collector as a system service that can be managed via systemctl.
Step 2: Configure the OpenTelemetry Collector
Next, we need to configure the collector to scrape GitHub metrics and send them to OpenObserve. Open the configuration file:
sudo vi /etc/otelcol-contrib/config.yaml
Replace the content with the following configuration:
extensions:
  bearertokenauth/github:
    token: <PAT> # Replace with your GitHub Personal Access Token

receivers:
  github/private-repo:
    initial_delay: 1s
    collection_interval: 60s
    scrapers:
      scraper:
        #metrics:  #Optional
        #vcs.contributor.count:
        # enabled: true
    github_org: <Your Org>
    search_query: "org:<Your Org> is:private"
    auth:
      authenticator: bearertokenauth/github

  github/pr-open:
    initial_delay: 1s
    collection_interval: 60s
    scrapers:
      scraper:
        #metrics:  #Optional
        #vcs.contributor.count:
        # enabled: true
    github_org: <Your Org>
    search_query: "org:<Your Org> is:pr is:open"
    auth:
      authenticator: bearertokenauth/github

exporters:
  otlphttp/openobserve:
    endpoint: OPENOBSERVE_ENDPOINT
    headers:
      Authorization: Basic <token> # Replace with your OpenObserve Basic auth token

service:
  extensions: [bearertokenauth/github]
  telemetry:
    logs:
      level: debug
  pipelines:
    metrics:
      receivers: [github/private-repo, github/pr-open]
      exporters: [otlphttp/openobserve]
Configuration Breakdown:
- Extensions: Sets up the GitHub bearer token authentication
- Receivers: Configures two GitHub metric collectors
github/private-repo: Collects metrics from private repositoriesgithub/pr-open: Tracks open pull requests
- Exporters: Configures the OpenObserve endpoint
- Service: Defines how the components are connected
Important: Replace
<PAT>with your GitHub Personal Access Token and<token>with your OpenObserve Basic auth token. Also ensure your OpenObserve stream is set to github to be able to import the prebuilt dashboard.
Step 3: Start the OpenTelemetry Collector Service
After configuring the collector, restart the service to apply the changes:
sudo systemctl restart otelcol-contrib
Verify that the service is running correctly:
sudo systemctl status otelcol-contrib
You should see output indicating that the collector is running without errors. If there are issues, check the logs:
sudo journalctl -u otelcol-contrib -f
Step 4: View Your GitHub Metrics in OpenObserve
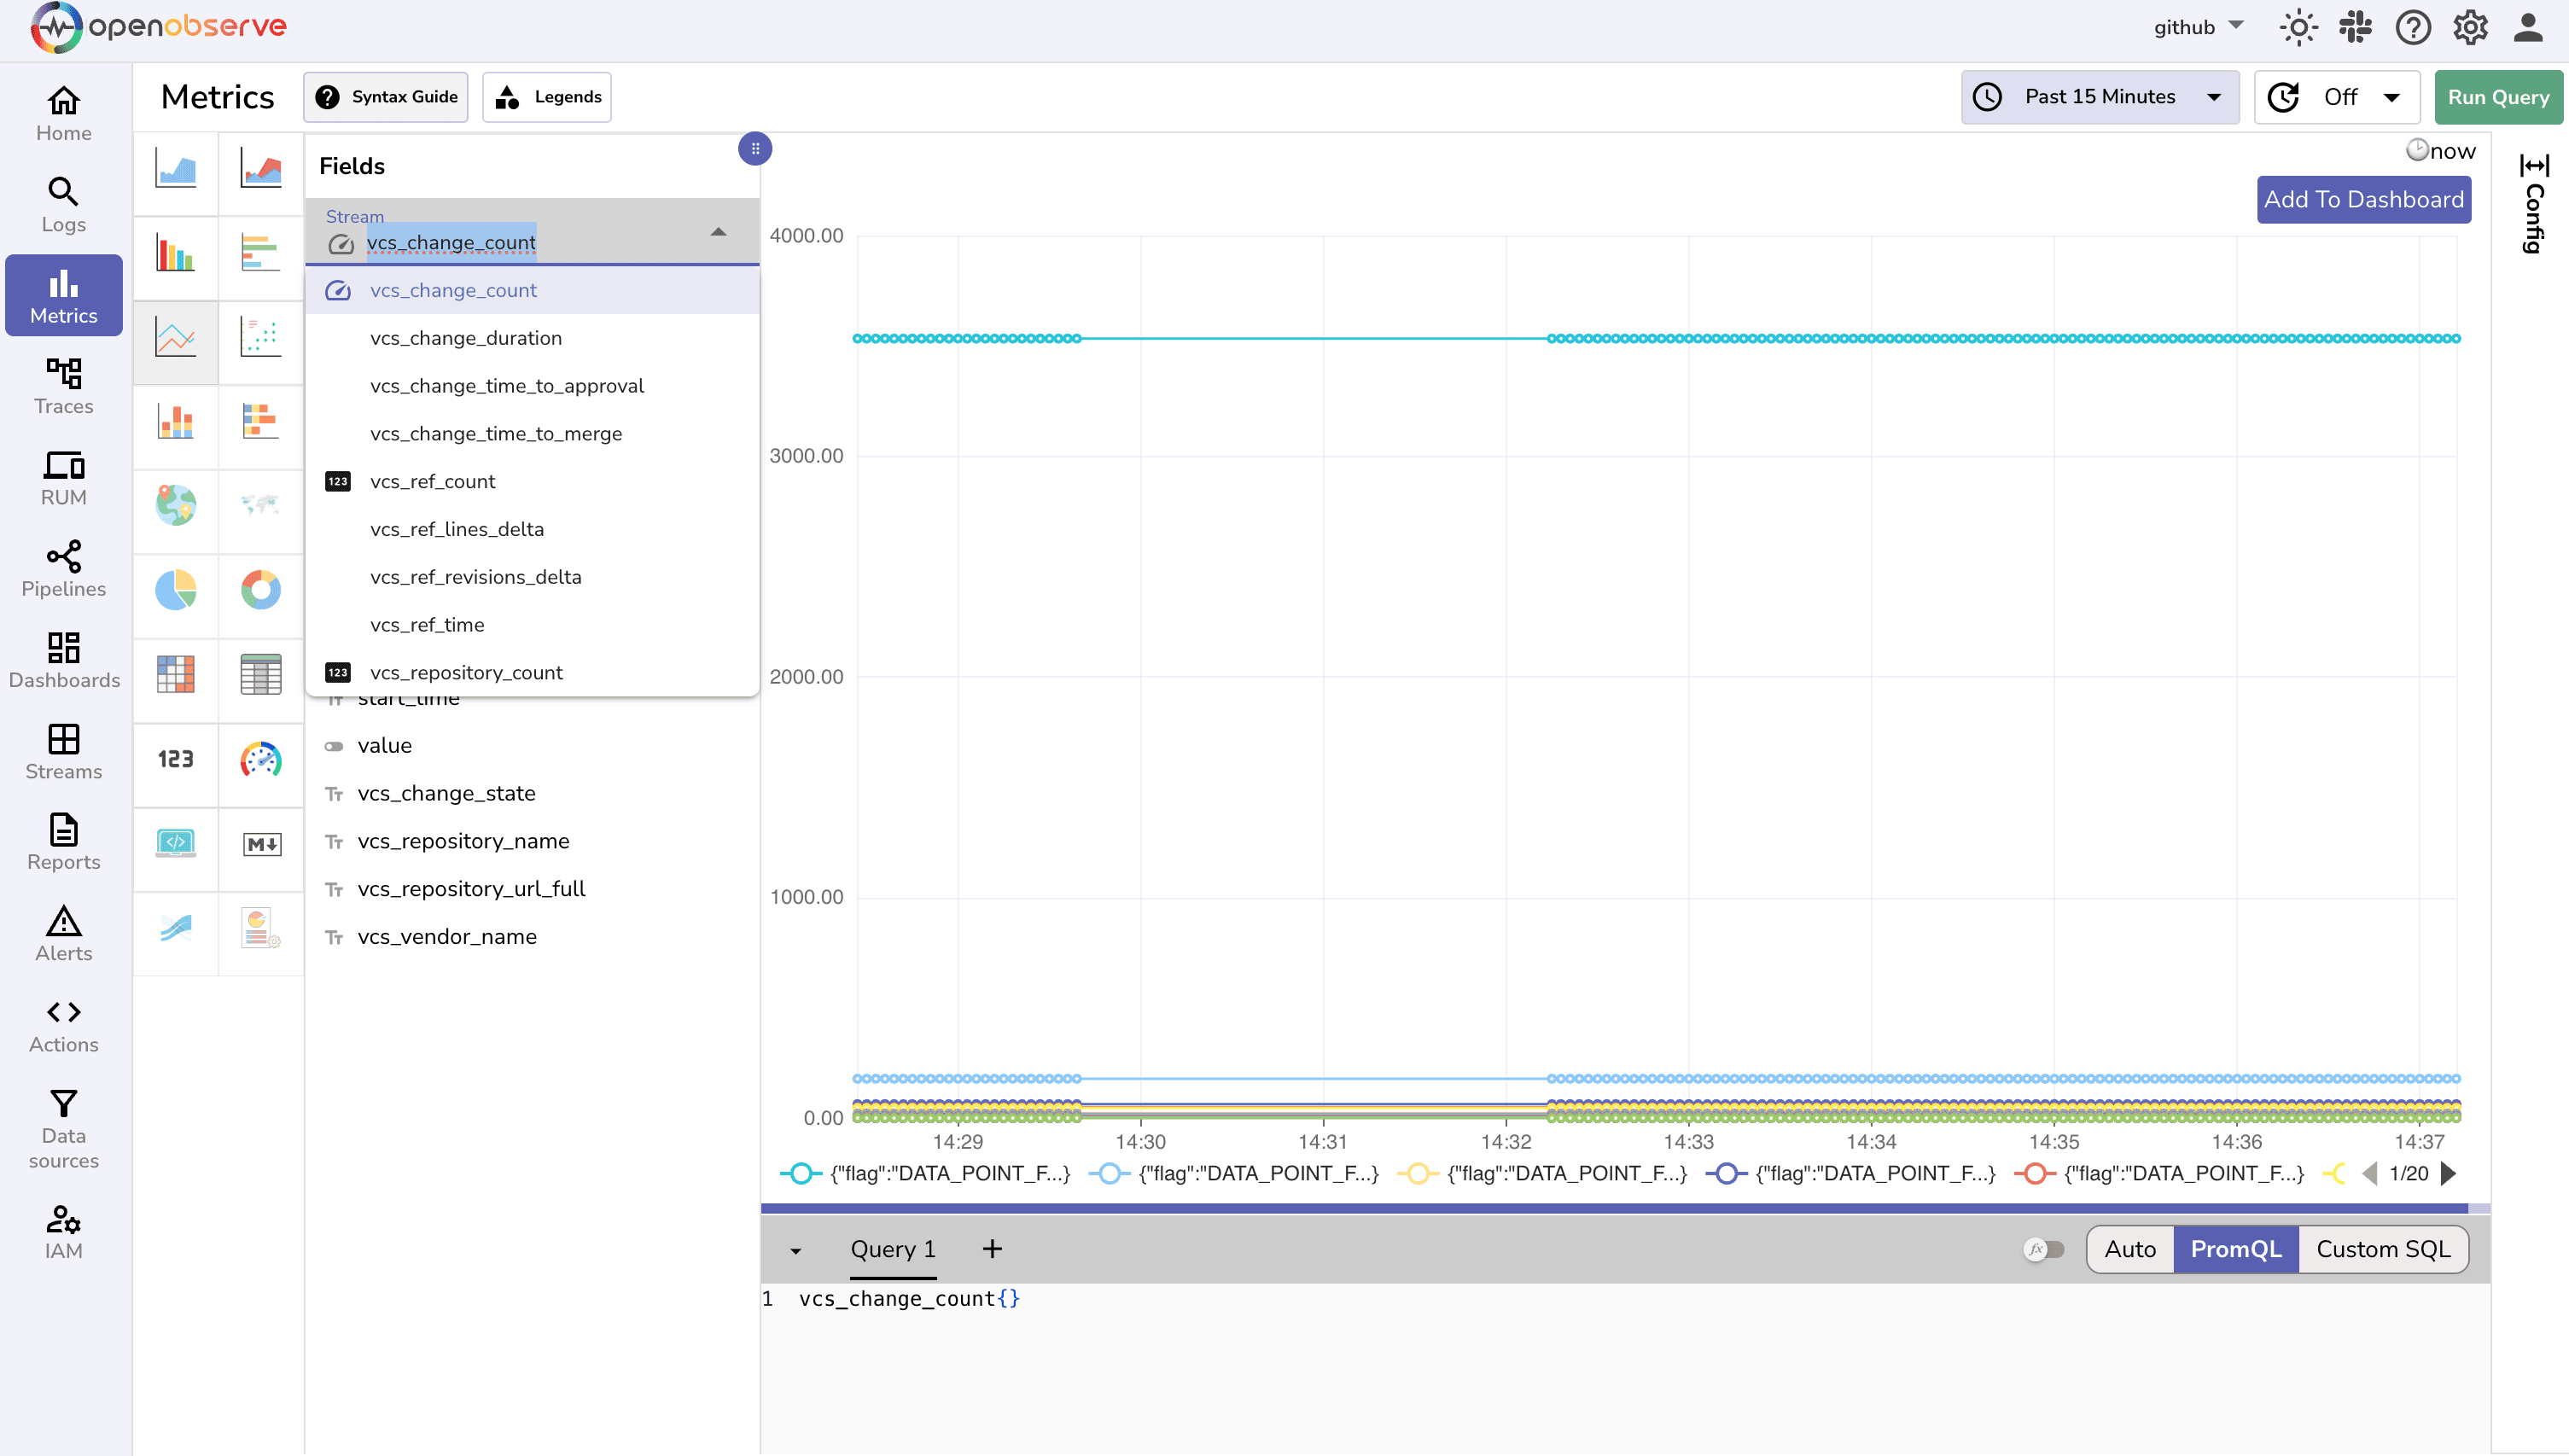
Once the collector is running, it will start sending GitHub metrics to your OpenObserve instance. To view these metrics:
- Log in to your OpenObserve dashboard
- Navigate to the GitHub metrics data stream
- You should start seeing metrics flowing in within a minute or two
Step 5: Set Up a Pre-built Dashboard
To get the most out of your GitHub metrics, import the pre-built dashboard into OpenObserve:
- Download the dashboard JSON file
- In OpenObserve, navigate to Dashboards
- Click "Import" and select the downloaded JSON file
- Save the dashboard
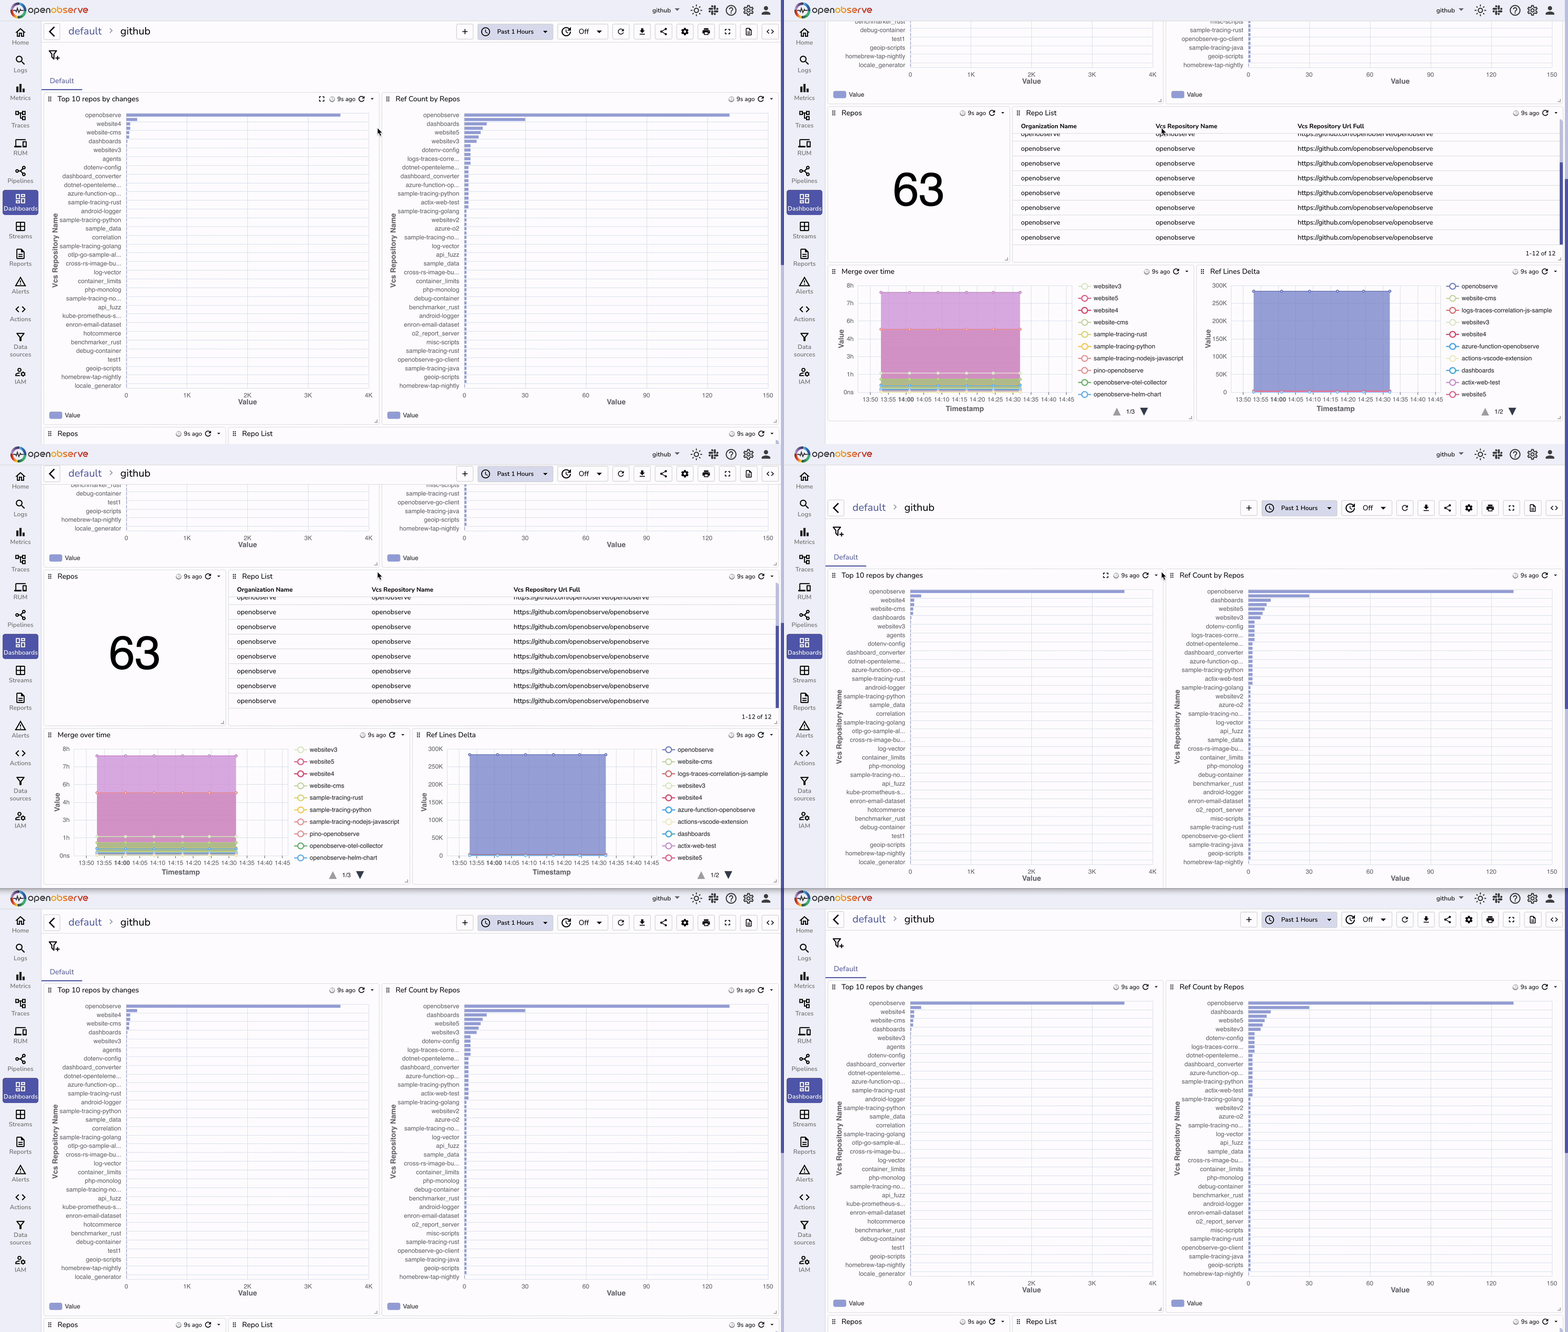
The pre-built dashboard provides visualizations for:
- Repository activity over time
- Ref count over time
- Repository metrics
- Merge Time
- Ref lines Delta
What Metrics Are Being Collected?
The GitHub receiver collects a wide range of metrics, including:
- Repository metrics: Size, stars, forks, watchers
- Pull request metrics: Open PRs, time to merge, review status
- Contributor metrics: Active contributors, commit frequency
- Issue metrics: Open issues, issue resolution time
These metrics provide valuable insights into your development process, team productivity, and code quality.
Use Cases for GitHub Metrics Monitoring
1. Development Velocity Tracking
Monitor how quickly your team is moving by tracking:
- Commit frequency
- PR merge rates
- Time to close issues
2. Code Quality Monitoring
Keep an eye on code quality indicators:
- PR rejection rates
- Review comments per PR
- Build failures
3. Team Collaboration Analysis
Understand how your team works together:
- Contributor distribution
- Review participation
- Cross-repository activity
Advanced Configuration Options
Filtering Specific Repositories
You can modify the search_query parameter to filter specific repositories:
search_query: "org:<YOUR_ORG> repo:<YOUR_REPO> is:private"
Adjusting Collection Frequency
For more or less frequent updates, modify the collection_interval:
collection_interval: 300s # Collect every 5 minutes
Enabling Specific Metrics
Uncomment and modify the metrics section to enable only specific metrics:
metrics:
  vcs.contributor.count:
    enabled: true
  vcs.pull_request.open:
    enabled: true
Troubleshooting
No Data in OpenObserve
If you're not seeing data in OpenObserve:
- Check the collector logs for errors:
sudo journalctl -u otelcol-contrib -f - Verify your GitHub PAT has the necessary permissions
- Confirm your OpenObserve endpoint and authentication details are correct
Rate Limiting Issues
GitHub API has rate limits. If you hit these limits:
- Increase the
collection_intervalto reduce API calls - Consider using a GitHub App instead of a PAT for higher rate limits
Conclusion
Setting up GitHub metrics monitoring with OpenTelemetry and OpenObserve provides valuable insights into your development process. By following this guide, you've created an end-to-end monitoring solution that helps you understand your GitHub activity better.
This monitoring setup can help you identify bottlenecks in your development process, track team productivity, and ensure code quality standards are maintained.
Ready to take your GitHub metrics monitoring to the next level? Consider expanding your telemetry by integrating with CI/CD systems and code quality tools for a complete view of your development pipeline.
Additional Resources
Get Started with OpenObserve Today!
Sign up for a free trial of OpenObserve on our website. Check out our GitHub repository for self-hosting and contribution opportunities.
Happy monitoring!
About the Author
Chaitanya Sistla

Chaitanya Sistla is a Principal Solutions Architect with 17X certifications across Cloud, Data, DevOps, and Cybersecurity. Leveraging extensive startup experience and a focus on MLOps, Chaitanya excels at designing scalable, innovative solutions that drive operational excellence and business transformation.