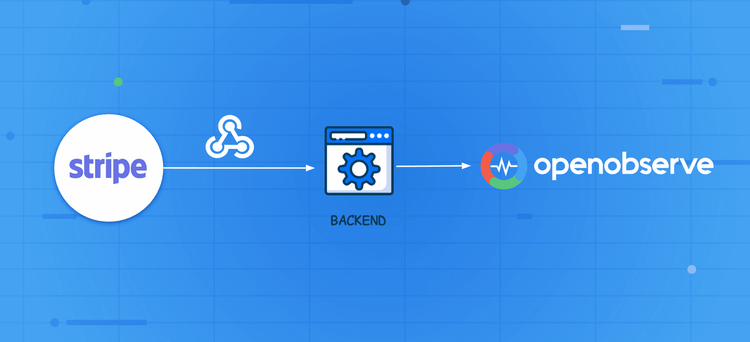
Enable end-to-end payment monitoring by sending Stripe events to OpenObserve and analyzing success/failure rates using dashboards, SQL queries, and alerts.
OpenObserve v0.16.1 delivers meaningful new features including Alert History for debugging monitoring reliability, Pipeline History for execution tracking, and automatic Log Pattern extraction that groups millions of logs into actionable insights. This release brings significant performance improvements with optimized indexing and query execution, alongside UI/UX refinements that enhance readability and usability across the platform. Teams can now better understand their system behavior, reduce alert fatigue through deduplication, and troubleshoot issues faster with comprehensive execution history and diagnostics.
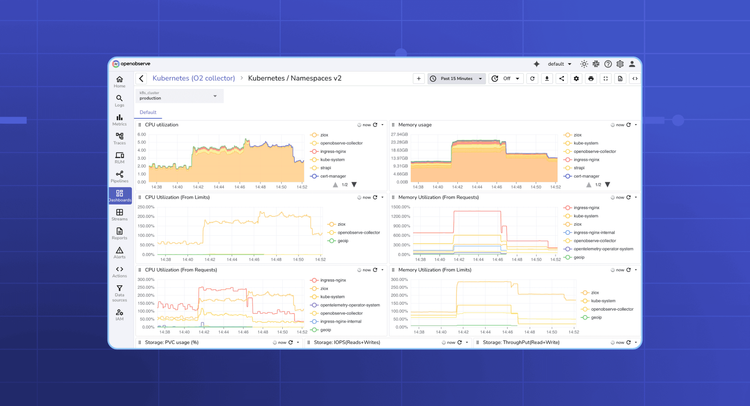
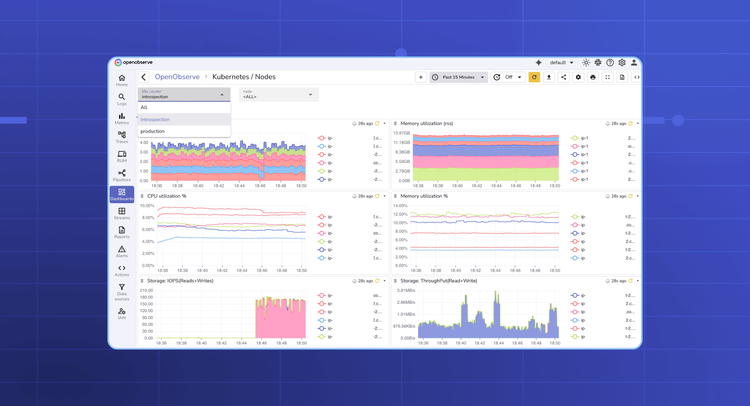
Import OpenObserve’s prebuilt Kubernetes dashboards for end-to-end visibility, trend analysis, and proactive alerts across clusters.
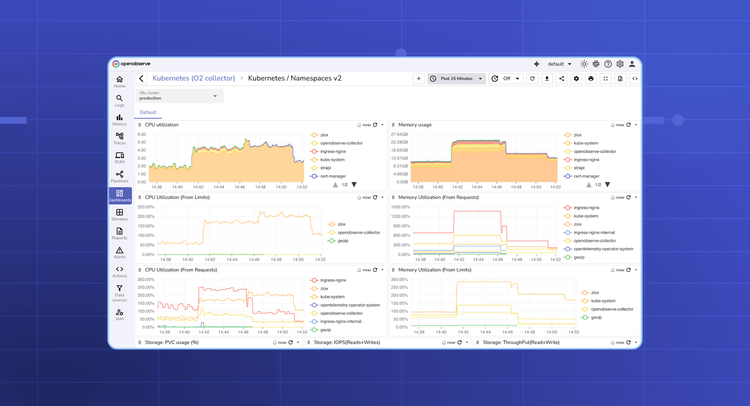
Build SRE/DevOps metrics dashboards fast. Docker, Jenkins, Kubernetes, GitHub, Argo CD, Prometheus, Hosts: what to track, why, and importable JSON.
Set up OpenObserve Report Server to turn dashboards into scheduled PDF emails. Learn env vars, SMTP (Gmail/SES), and Docker run.
Learn how Prometheus metrics counts unique label values using basic queries and methods like `count(count by (label) (metric))`.
A practical guide to observability dashboards: what to track, how to design panels, and how to build them with examples for logs, metrics, and traces.
Monitor Oracle Database performance with OpenTelemetry and OpenObserve. Collect metrics, logs, and build dashboards for real-time insights.
Master SLO-based alerting in OpenObserve. Easily set reliability targets, track error budgets, and cut alert noise with SQL-driven monitoring.
Learn how to create effective monitoring dashboards with OpenObserve. This guide covers installation, sample data setup, and dashboard creation, highlighting key features like customizable panels and dynamic filtering for enhanced application performance monitoring.


![Building Monitoring Dashboards with OpenObserve [Tutorial]](https://openobserve.ai/assets/medium_image16_fabb63f803.png)