How to Send AWS Lambda Traces to OpenObserve Using ADOT (AWS Distro for OpenTelemetry)

Manas Sharma
November 17, 2025
9 min read
Don’t forget to share!
Try OpenObserve Cloud today for more efficient and performant observability.
Get Started For Free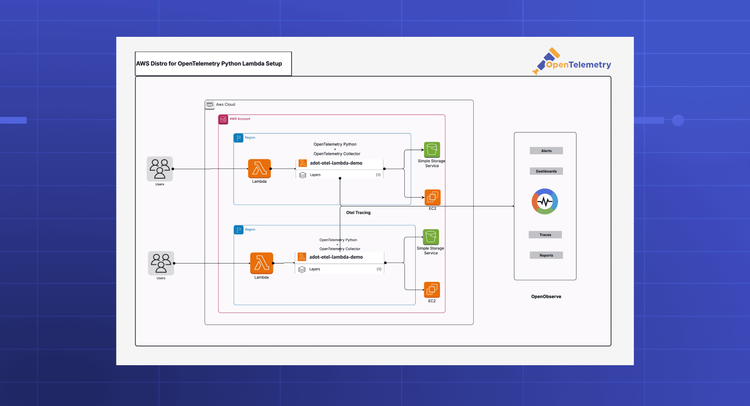
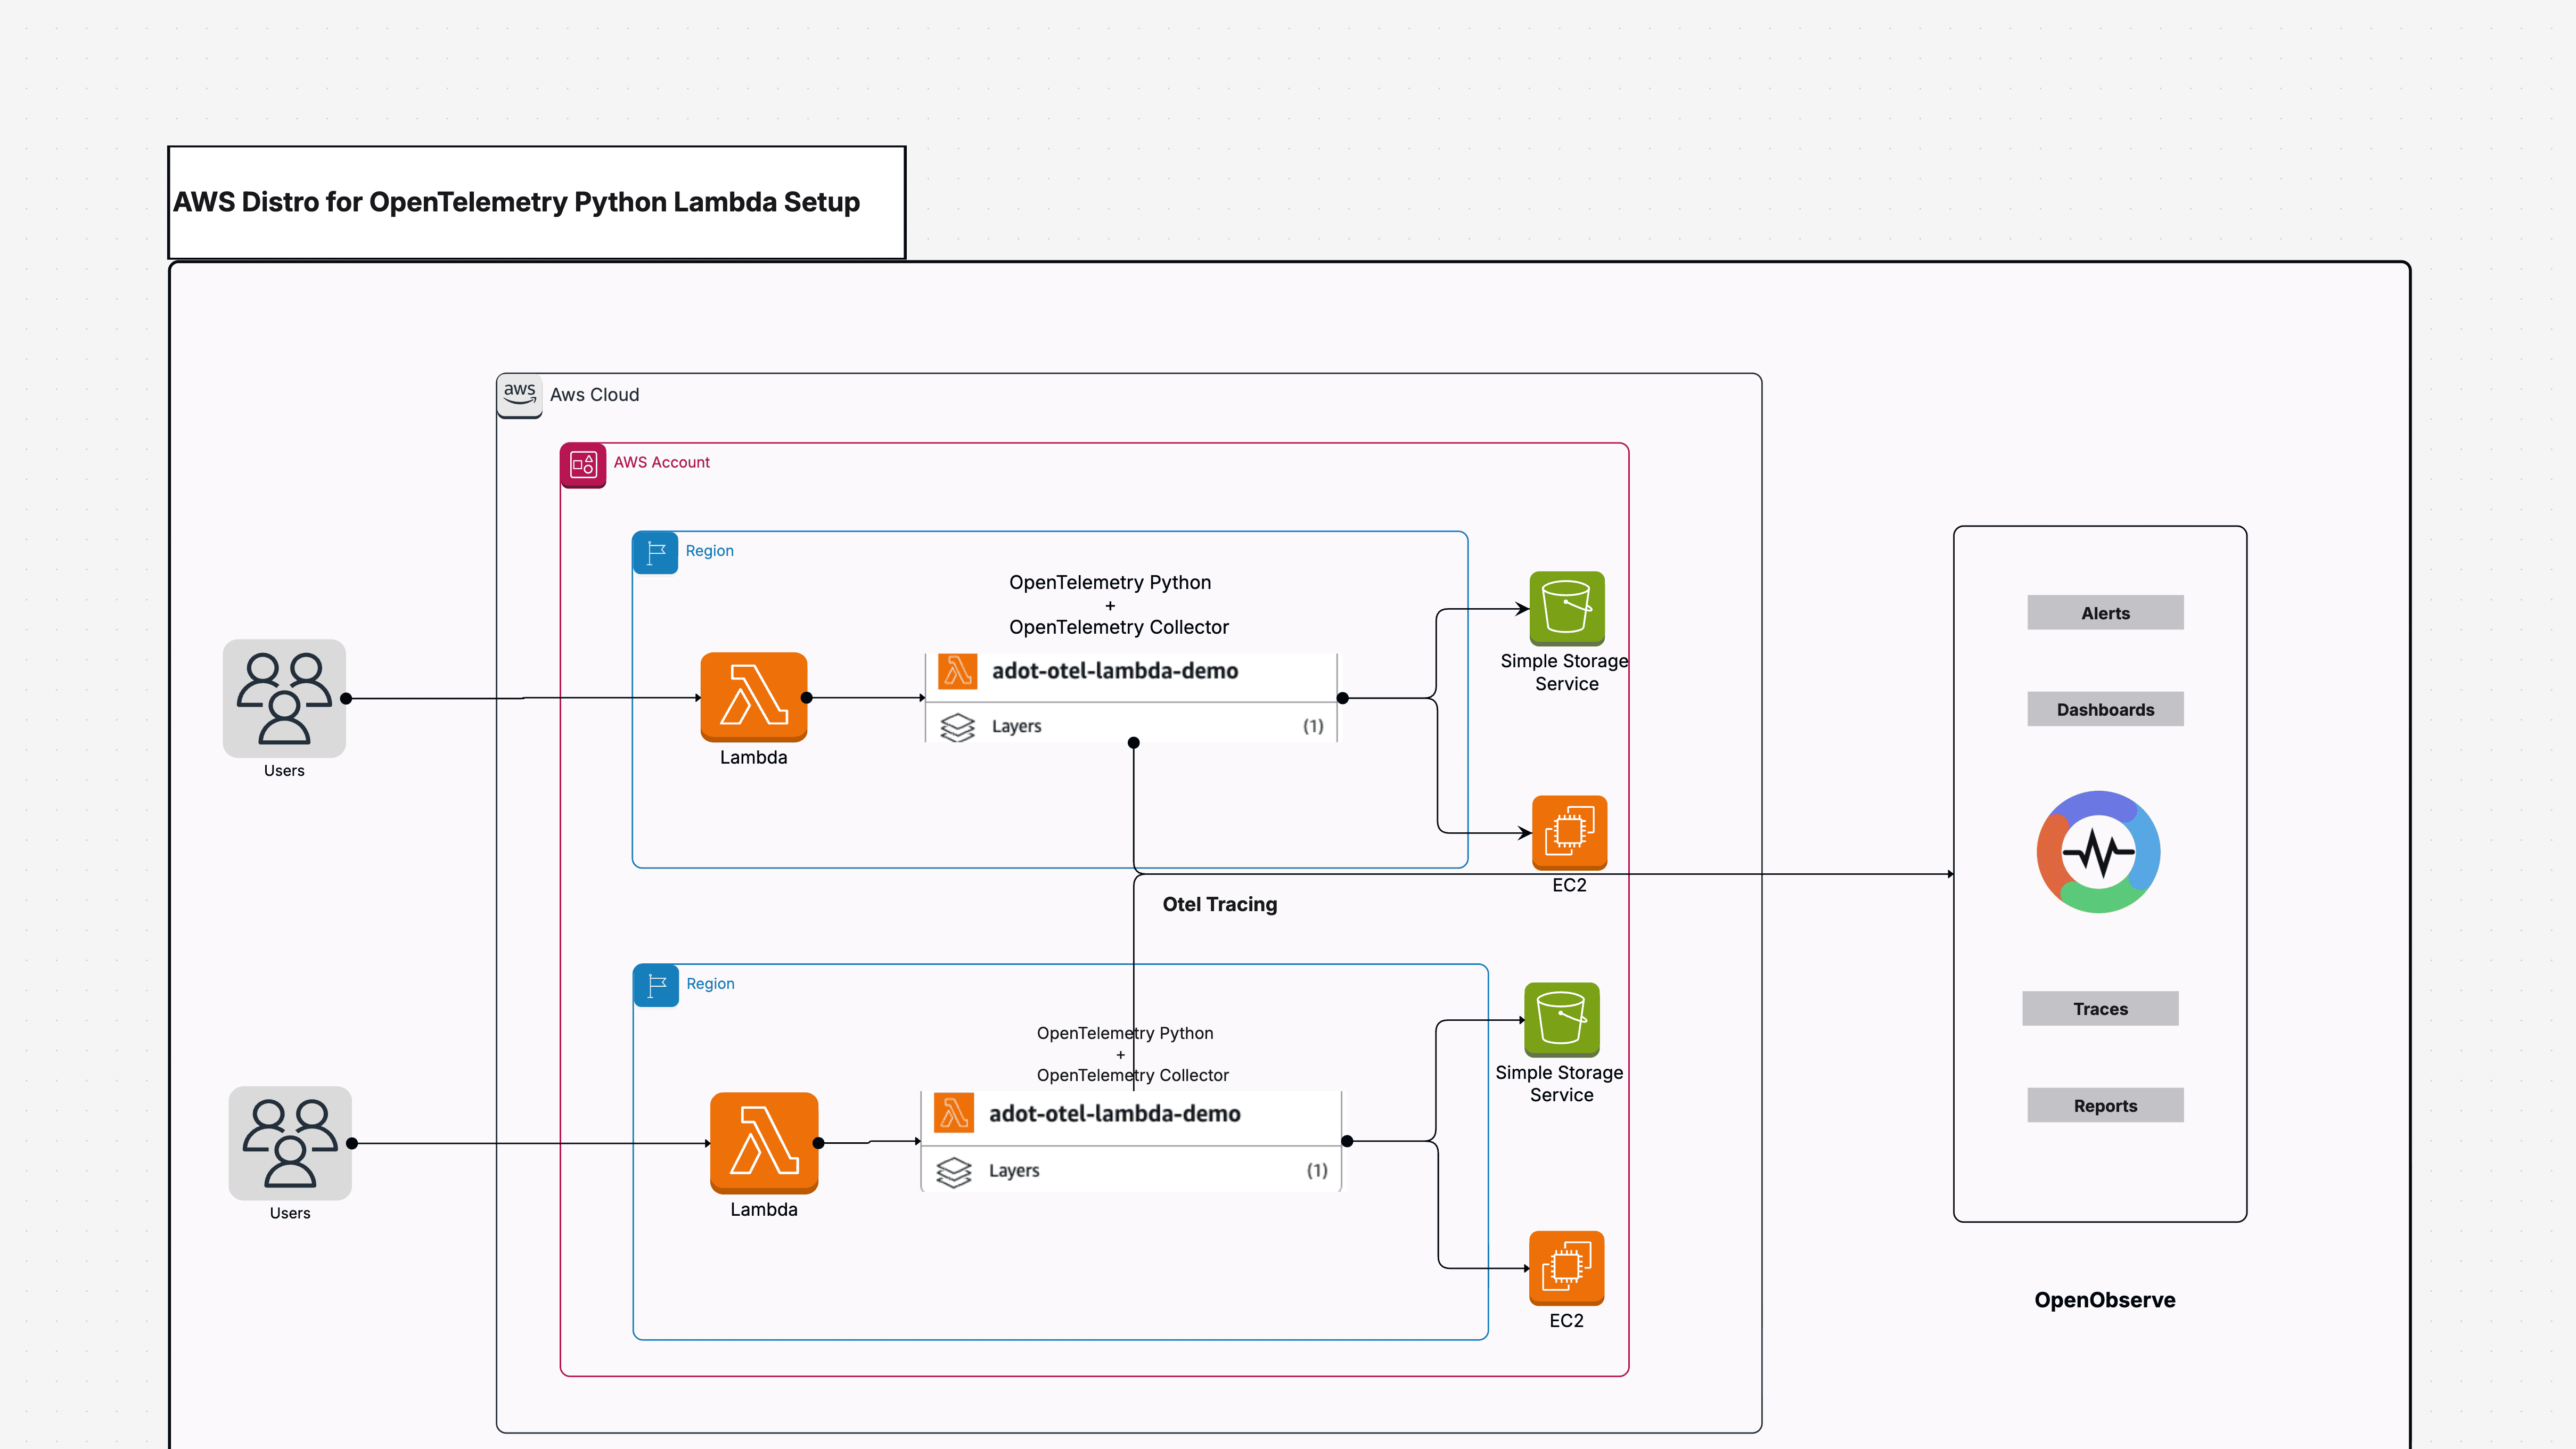
Distributed tracing in AWS Lambda has traditionally been tied to AWS X-Ray, but the ecosystem is shifting toward open standards. AWS is now pushing the AWS Distro for OpenTelemetry (ADOT) as the modern approach to observability, built on OpenTelemetry that works with any backend. This guide shows you how to auto-instrument a Python Lambda function using the ADOT layer and send traces to OpenObserve, an open source observability platform designed for OpenTelemetry native workloads.
By the end of this tutorial, you'll have a working Lambda function that automatically captures traces from AWS SDK calls and exports them to OpenObserve without writing any instrumentation code.
AWS Lambda's serverless nature makes observability challenging. You need to understand request flows, identify bottlenecks, and debug failures across distributed systems, all without access to the underlying infrastructure.
AWS X-Ray provided Lambda tracing for years, but it locks you into AWS specific tooling. As organizations adopt multi-cloud strategies and seek vendor neutral observability, OpenTelemetry has emerged as the industry standard. ADOT is AWS's distribution of OpenTelemetry, optimized for AWS services and fully compatible with any OpenTelemetry backend.
The benefits of using ADOT with OpenObserve include:
Automatic instrumentation: No code changes required. The ADOT Lambda layer intercepts AWS SDK calls and creates spans automatically.
Open standards: OpenTelemetry Protocol (OTLP) means you can switch backends without changing your instrumentation code.
Unified telemetry: ADOT supports traces, metrics, and logs in a single framework.
Cost efficiency: OpenObserve stores traces efficiently with lower ingestion and storage costs compared to commercial APM tools.
Full visibility: See the complete request lifecycle from Lambda invocation through AWS API calls to response.
This tutorial walks through instrumenting an AWS Lambda function written in Python that performs EC2 and S3 API operations. You'll configure the function to automatically export distributed traces to OpenObserve using the ADOT Lambda layer.
No application code changes are needed. All instrumentation happens through the Lambda layer and environment variables.
Before starting, ensure you have:
AWS Account: With permissions to create Lambda functions, attach layers, and manage IAM roles.
OpenObserve Instance: Either self-hosted or using OpenObserve Cloud. You'll need the base URL, organization name, and authentication credentials.
Basic Lambda Knowledge: Understanding of how Lambda functions work, IAM roles, and environment variables.
Start by creating a Lambda function that performs AWS API operations. We'll use EC2 and S3 as examples since they're common services where tracing helps identify performance issues.
Create a new Lambda function through the AWS Console:
adot-otel-lambda-demo)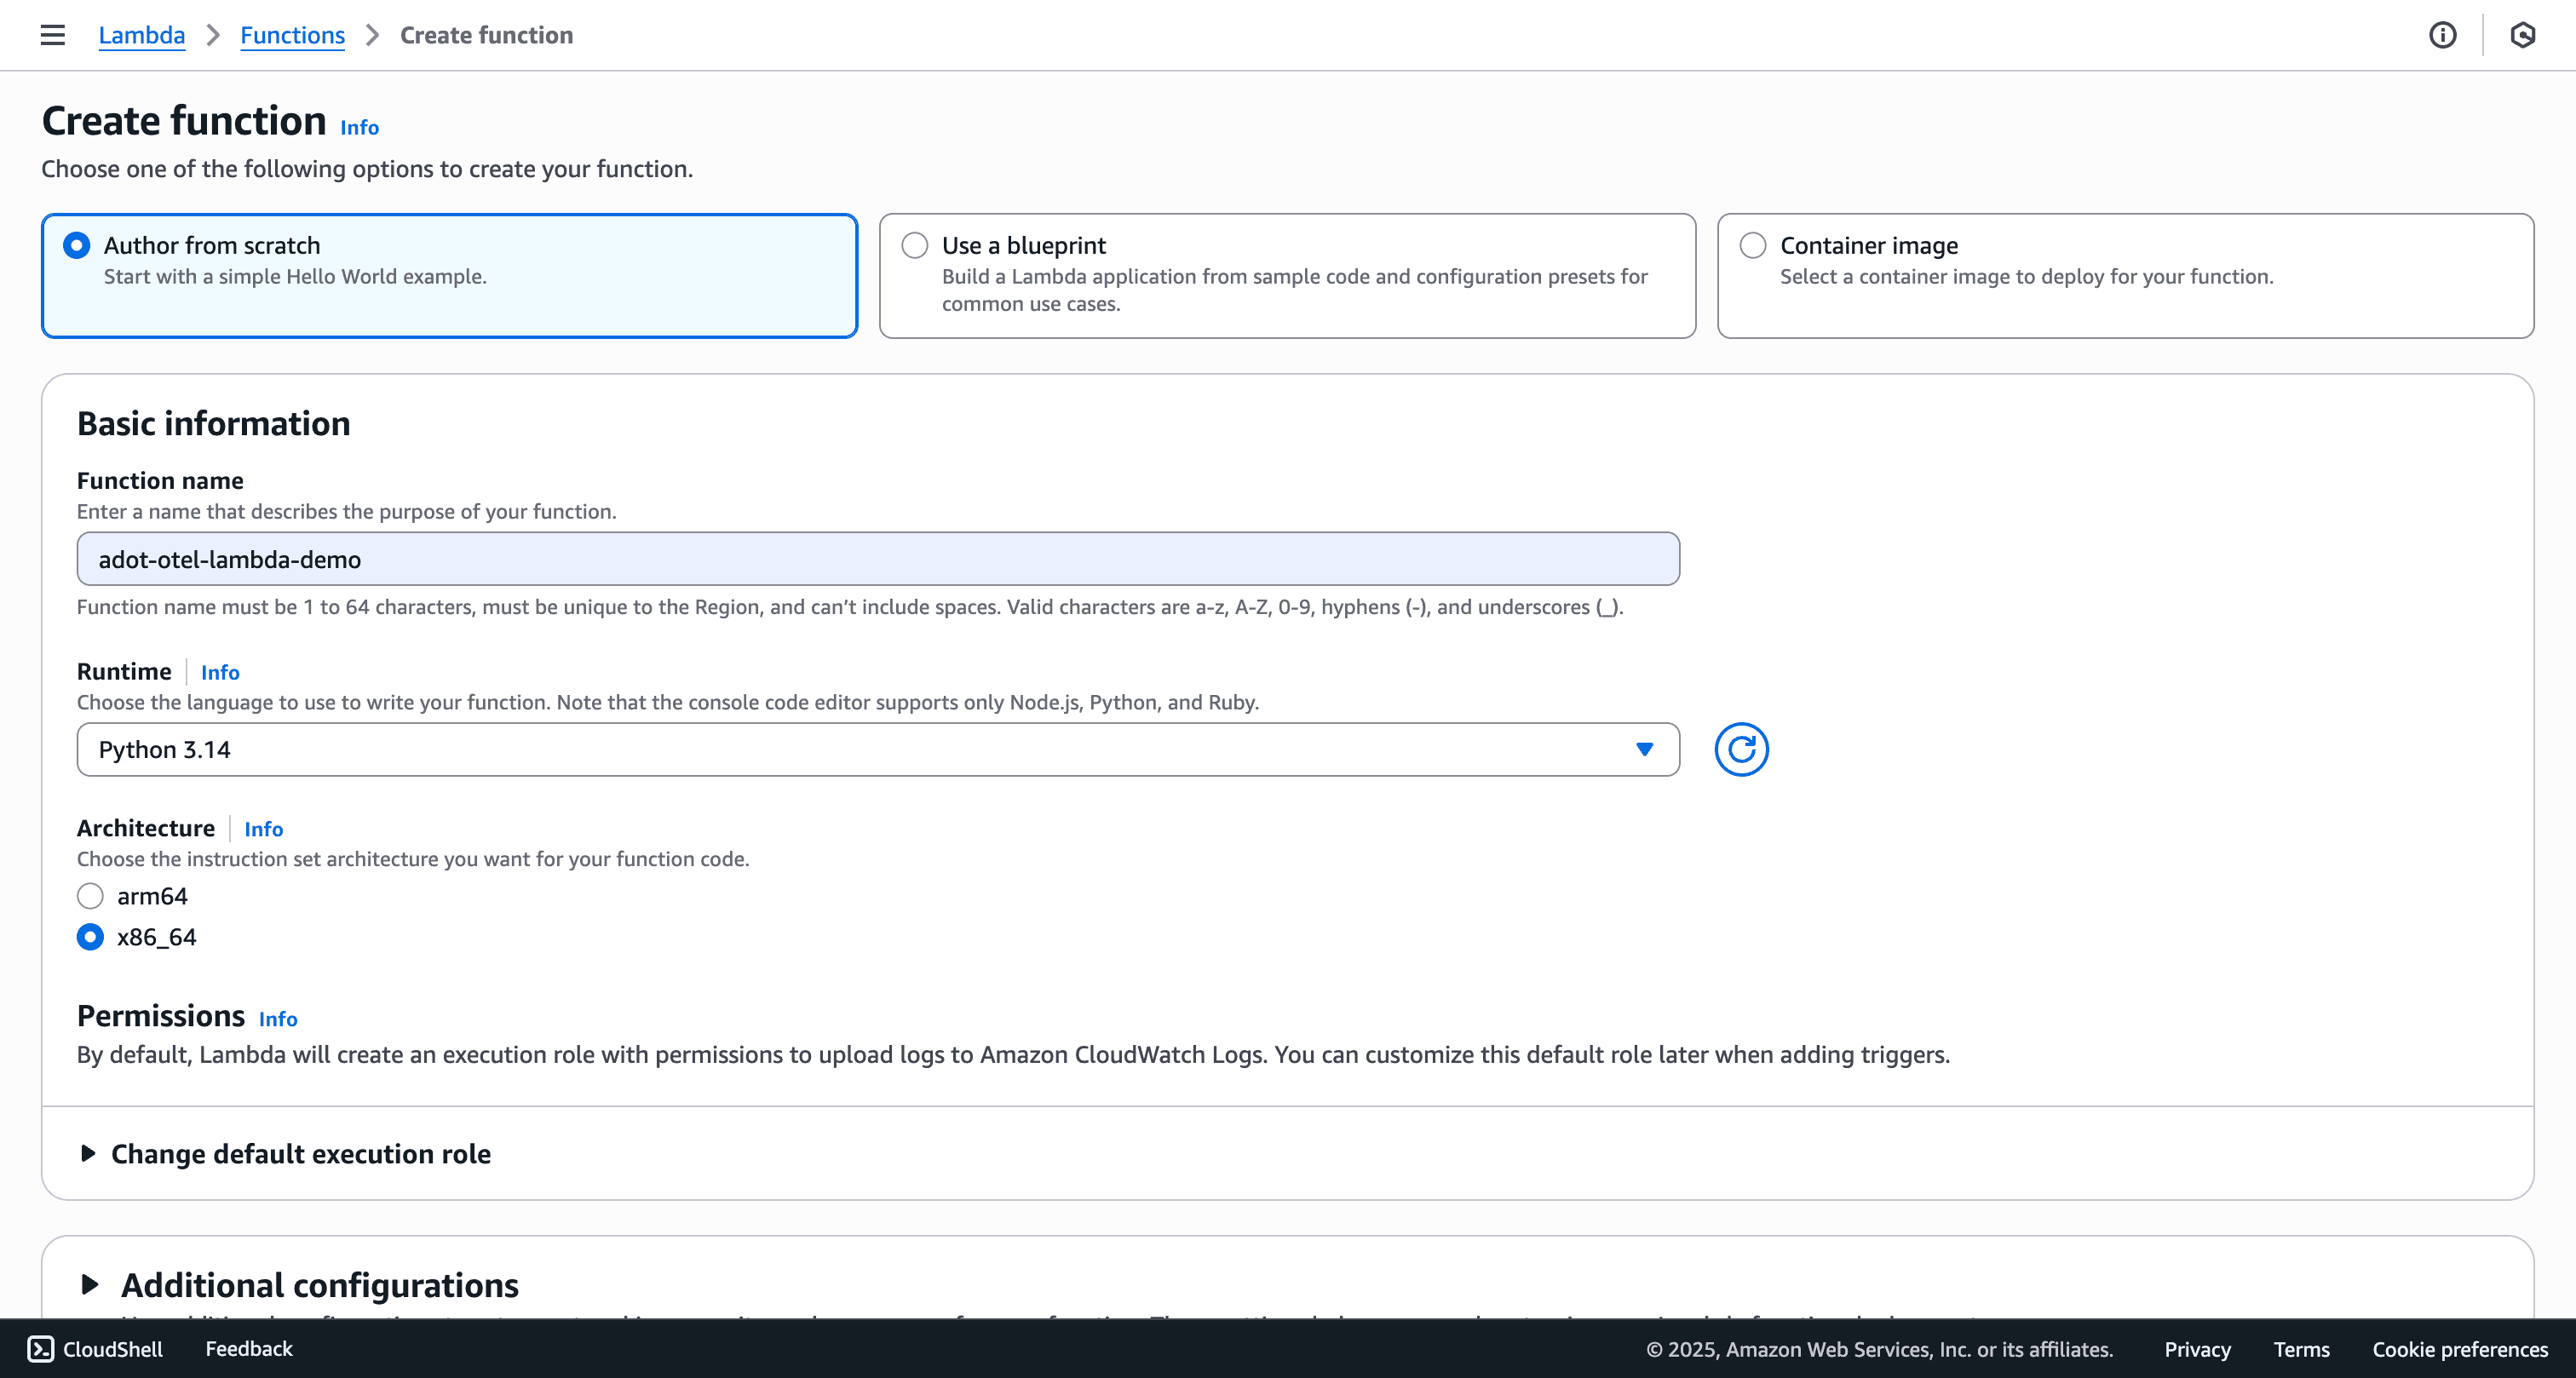
Create or select an IAM role with these AWS managed policies:
AmazonEC2ReadOnlyAccessAmazonS3ReadOnlyAccessAWSLambdaBasicExecutionRole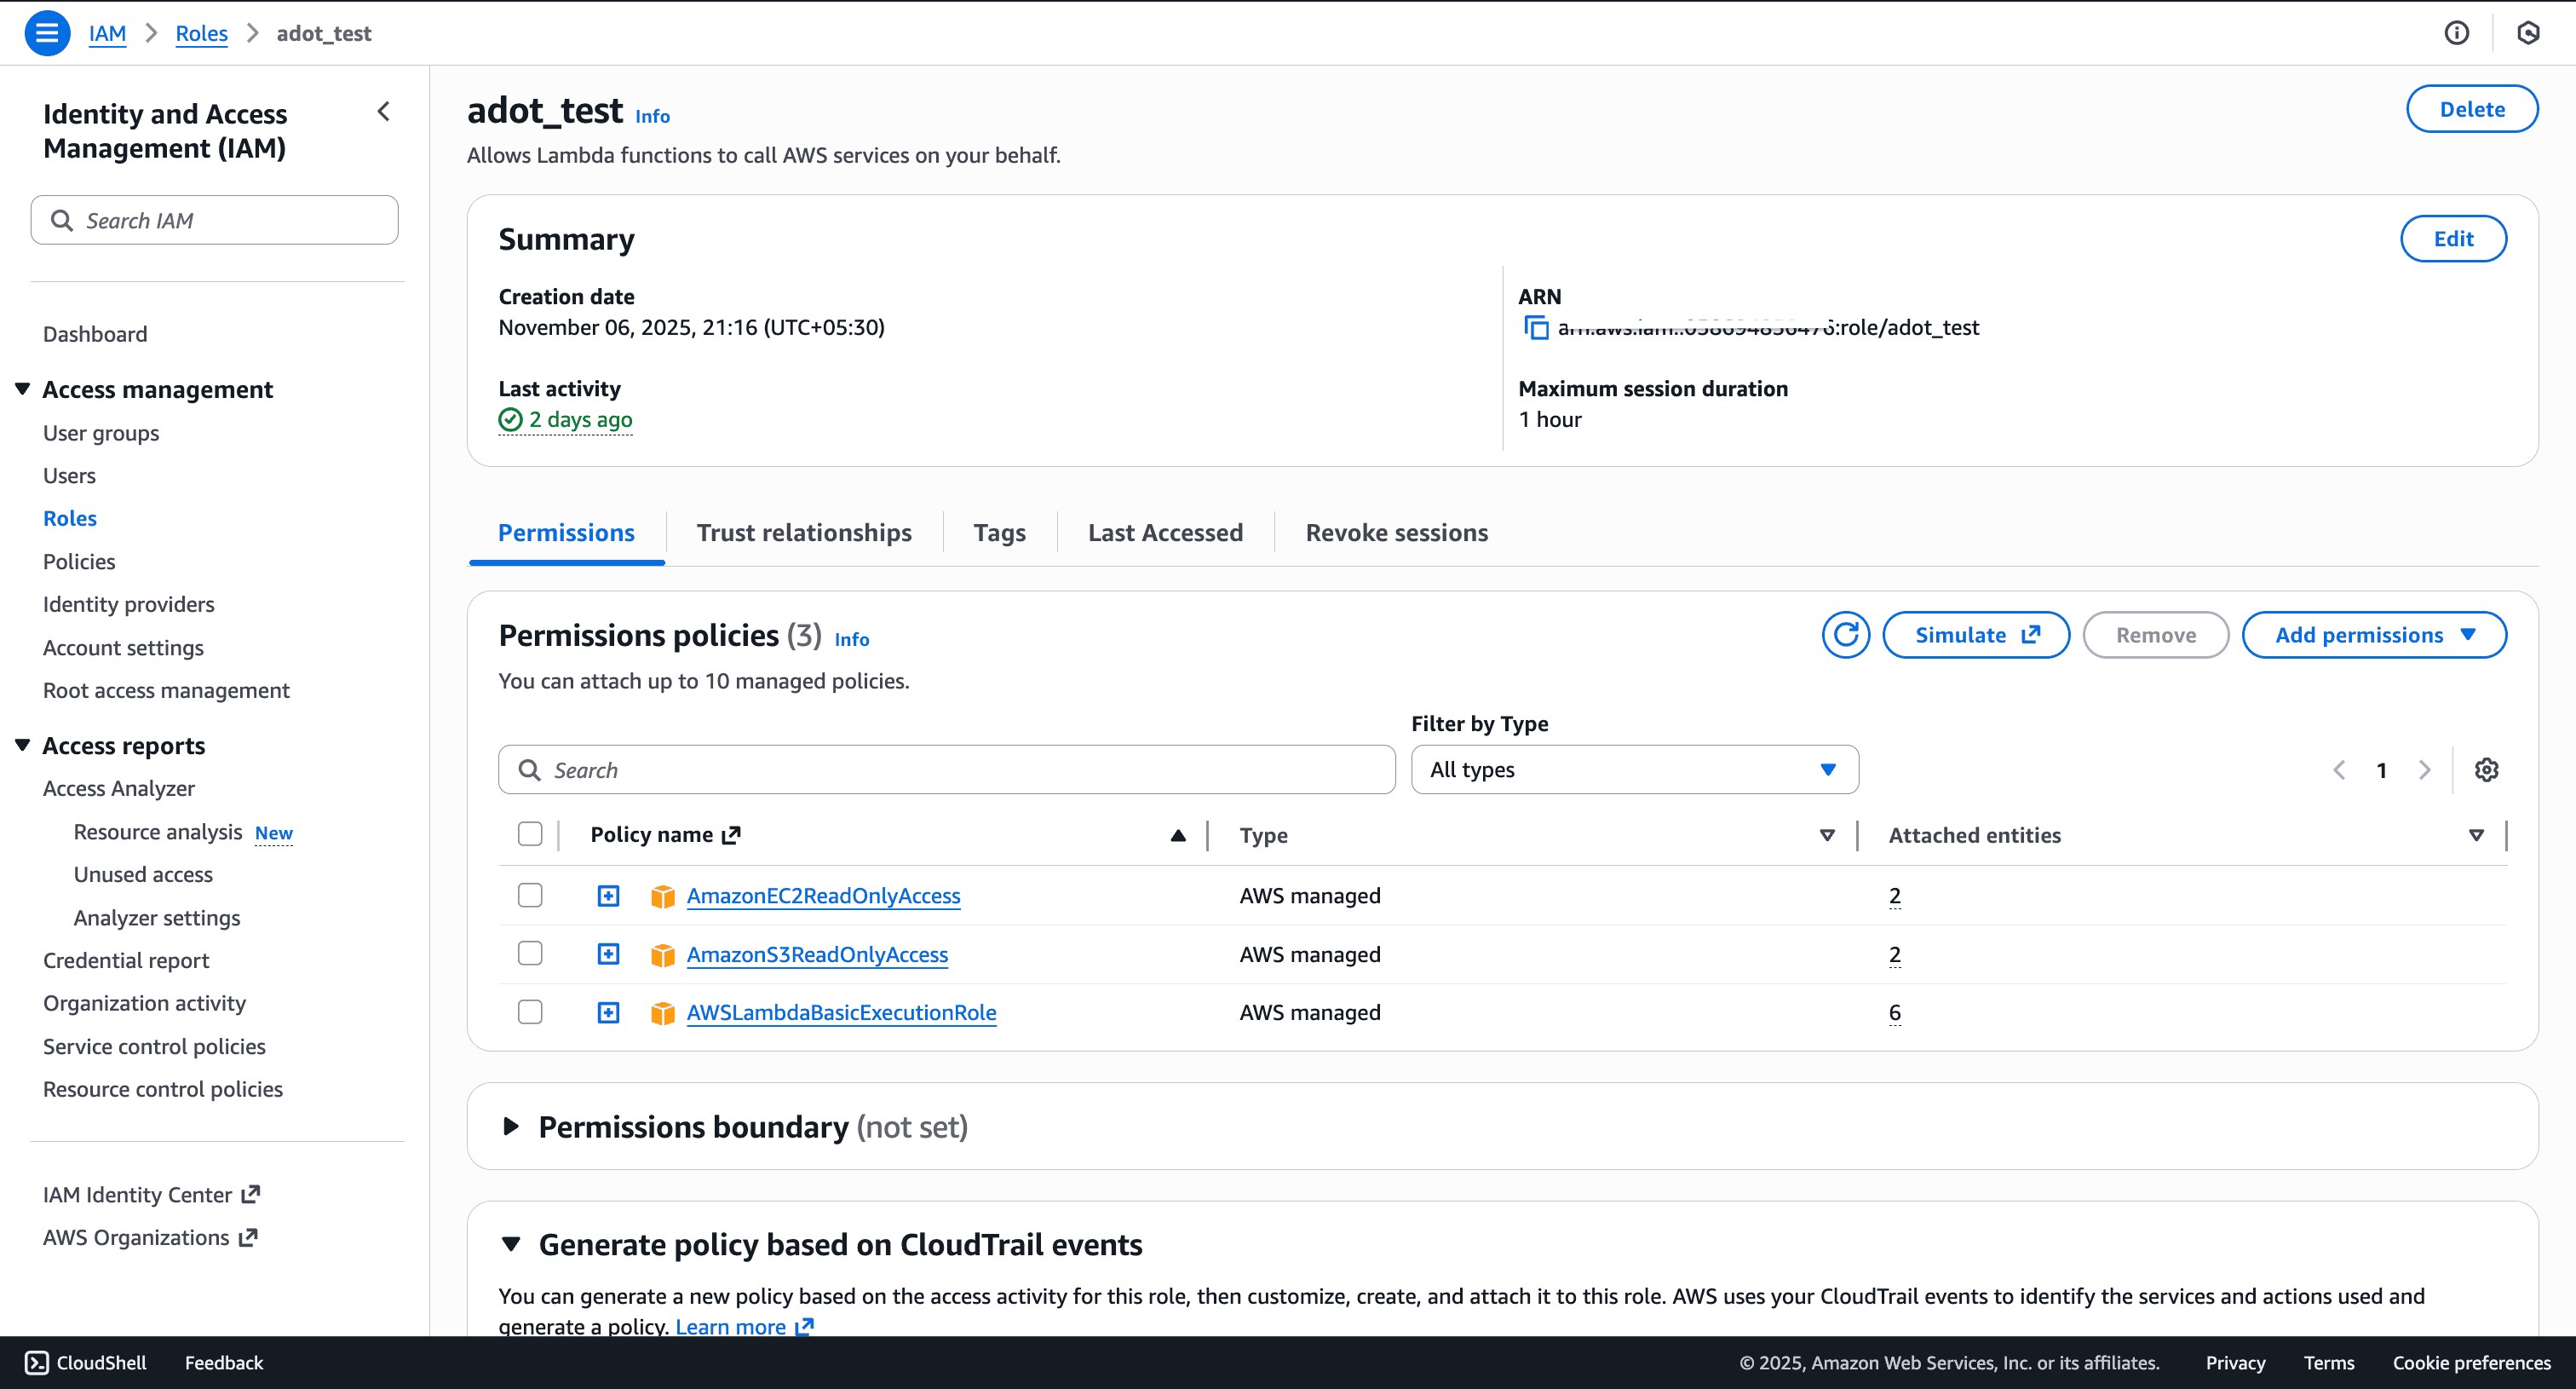
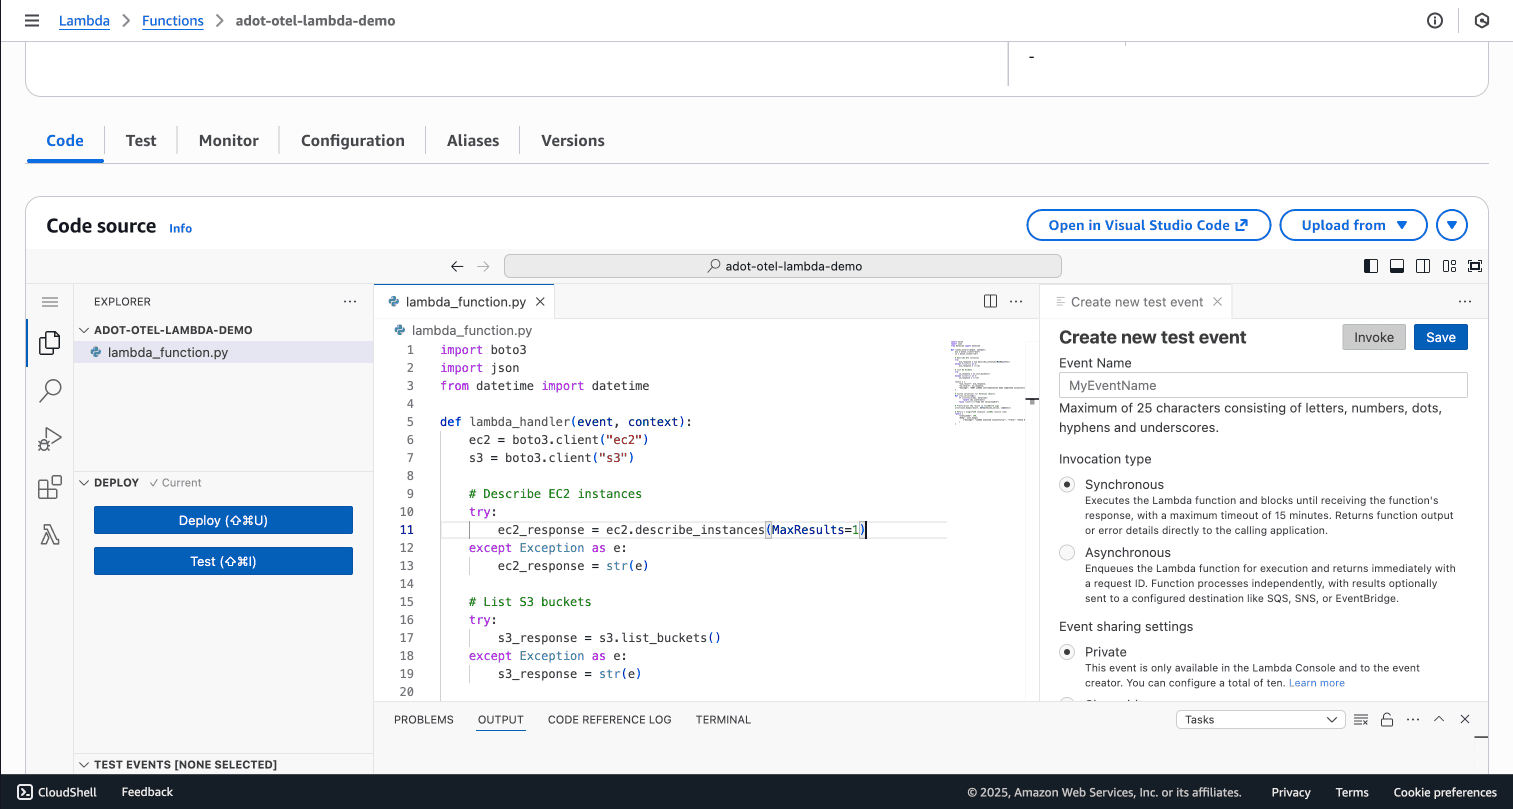
Add the following handler code:
import boto3
import json
from datetime import datetime

def lambda_handler(event, context):
    ec2 = boto3.client("ec2")
    s3 = boto3.client("s3")

    # Describe EC2 instances
    try:
        ec2_response = ec2.describe_instances(MaxResults=1)
    except Exception as e:
        ec2_response = str(e)

    # List S3 buckets
    try:
        s3_response = s3.list_buckets()
    except Exception as e:
        s3_response = str(e)

    result = {
        "ec2_result": ec2_response,
        "s3_result": s3_response,
        "message": "ADOT Lambda instrumentation demo completed successfully!"
    }

    # Custom serializer for datetime objects
    def json_serial(obj):
        if isinstance(obj, datetime):
            return obj.isoformat()
        raise TypeError("Type not serializable")

    # Pretty-print the result in CloudWatch Logs
    print(json.dumps(result, default=json_serial, indent=2))

    # Return a simplified response
    return {
        "statusCode": 200,
        "body": json.dumps(
            {"message": "Lambda executed successfully!", "trace": "Check OpenObserve for spans"}
        )
    }
Note: The code includes MaxResults=1 in the EC2 API call, which will generate an error because AWS requires a minimum value of 5. This is intentional. You'll see this error captured as a span in OpenObserve, demonstrating how distributed tracing helps debug failures.
Test the function to verify it executes successfully before adding instrumentation.
The ADOT Lambda layer contains the OpenTelemetry SDK and auto-instrumentation libraries. Lambda layers are regional resources, so the layer must exist in the same region as your Lambda function.
To find the correct layer ARN for your region and runtime:
The layer ARNs follow this format:
arn:aws:lambda:REGION:901920570463:layer:aws-otel-python-amd64-ver-X-XX-X:1
Where 901920570463 is the AWS account that publishes official ADOT layers.

The layer is now attached to your function. The ADOT libraries will load during Lambda initialization.
Configure how ADOT exports traces to OpenObserve through Lambda environment variables. All configuration happens here with no code changes required.
Navigate to Configuration → Environment variables in your Lambda function and add the following:
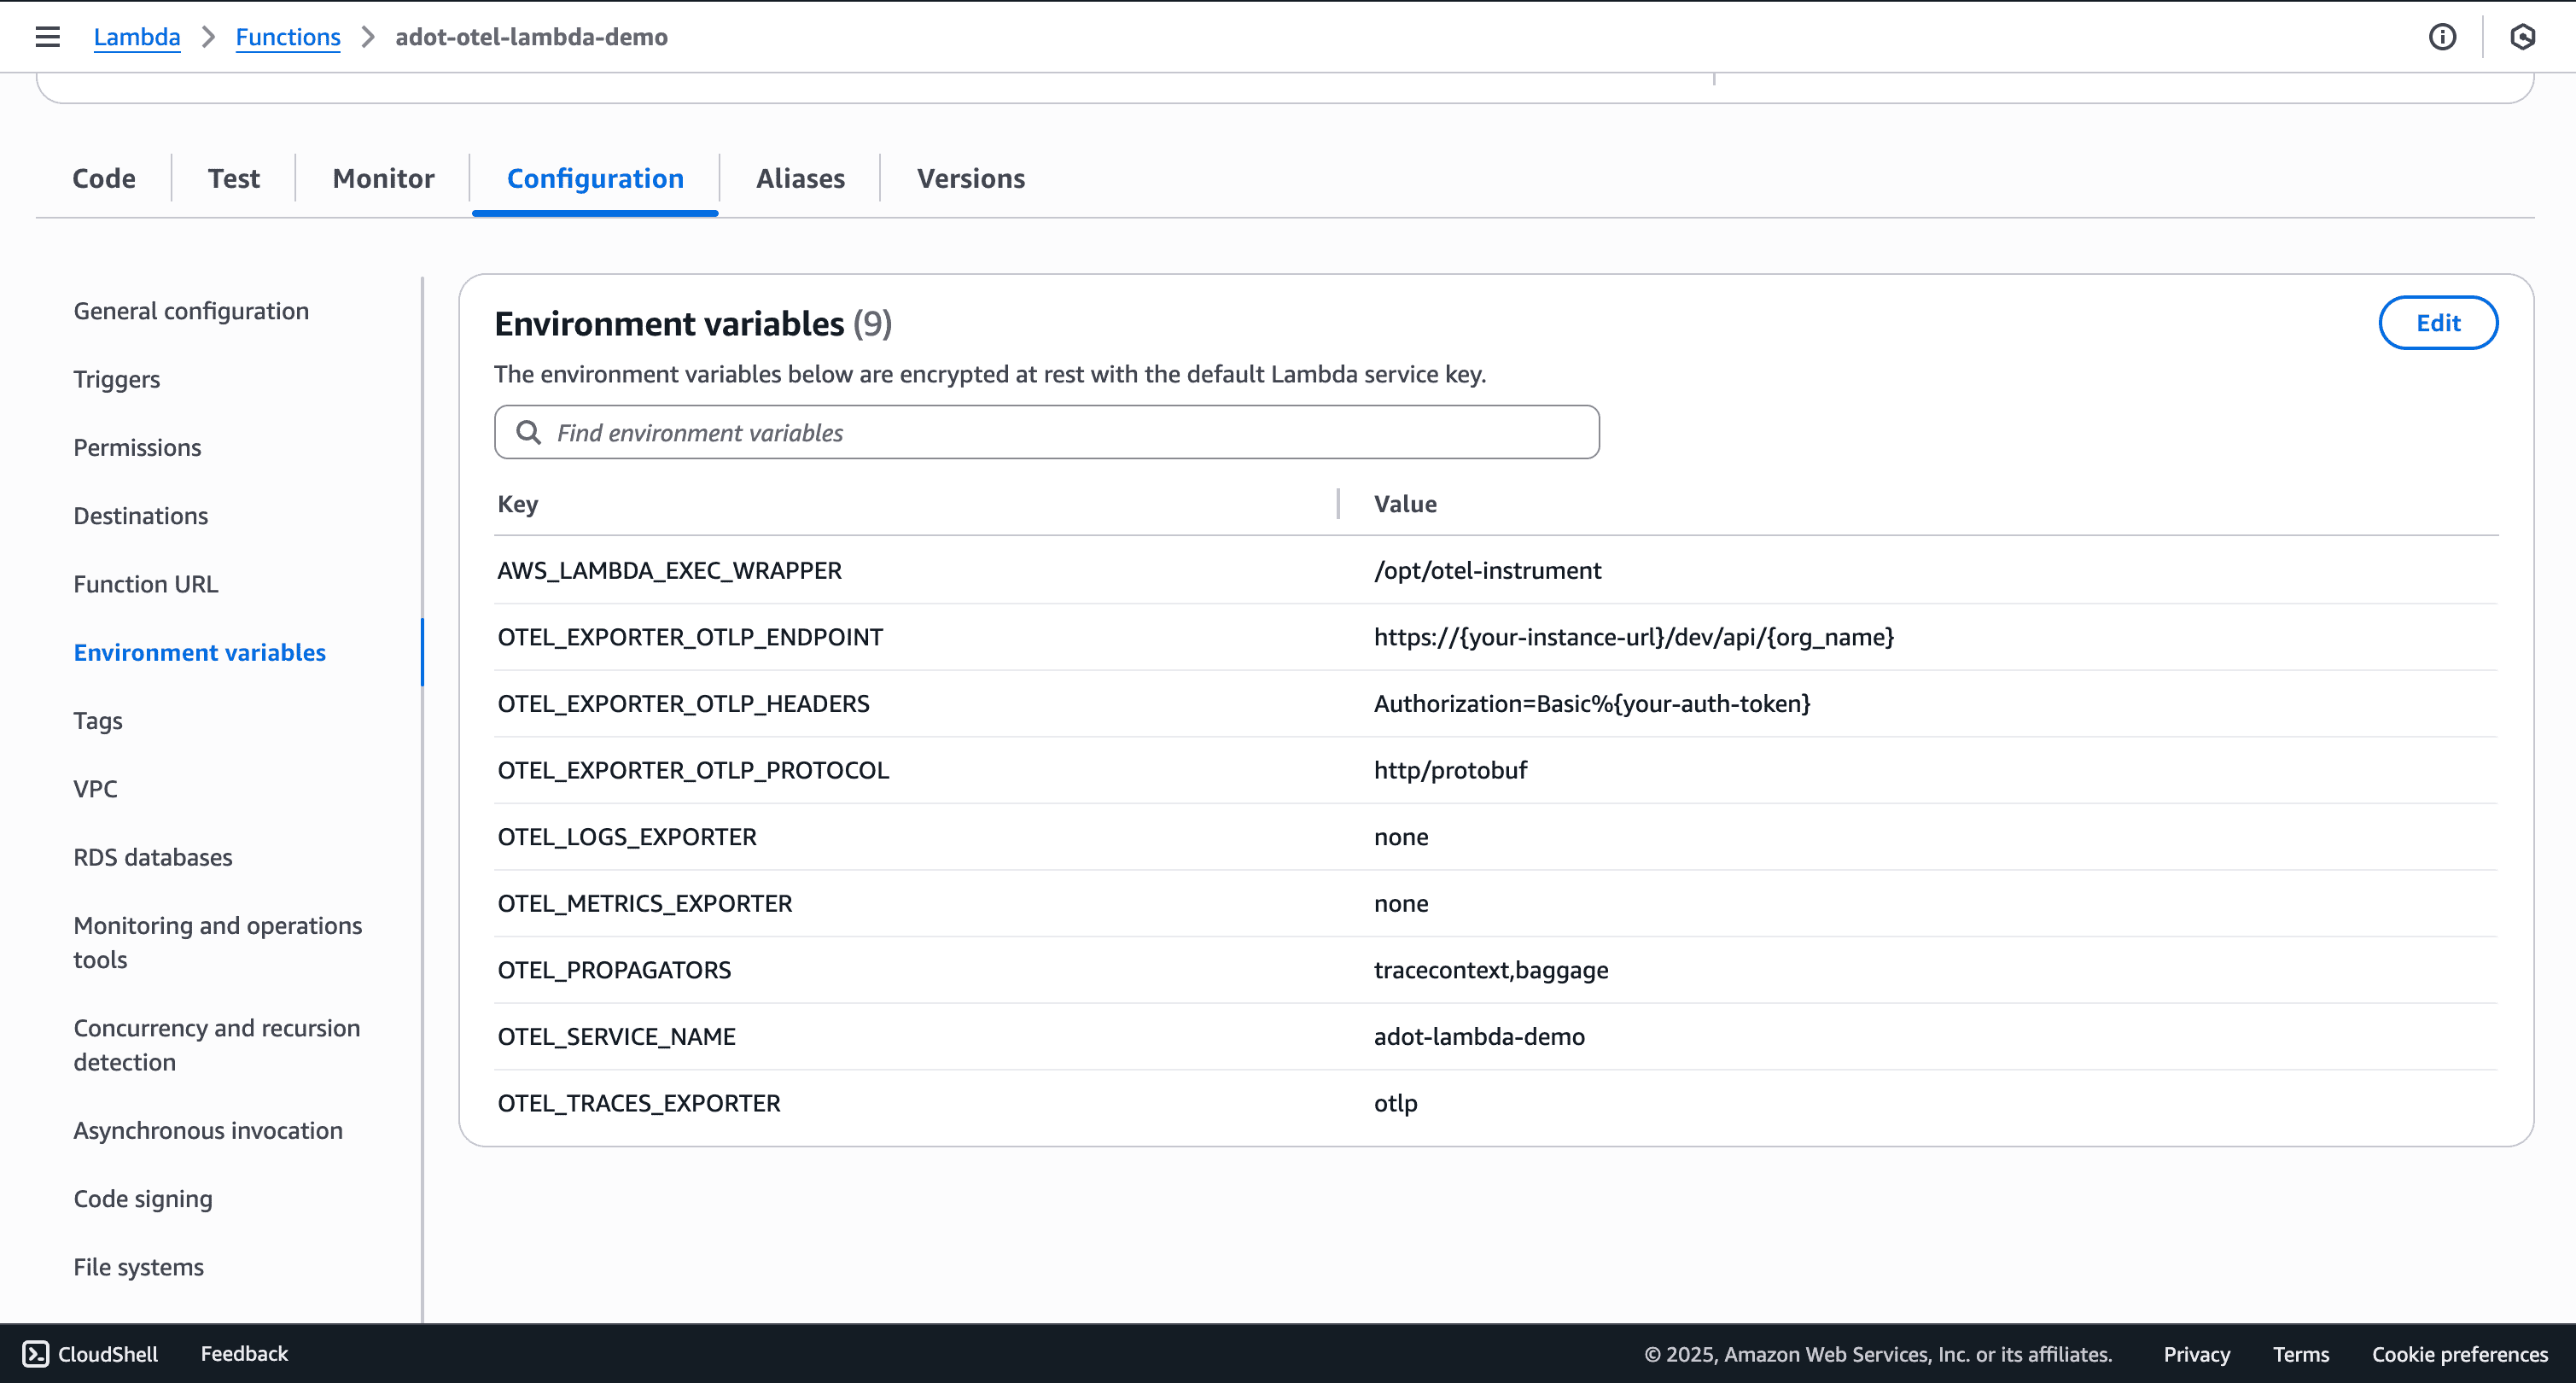
AWS_LAMBDA_EXEC_WRAPPER=/opt/otel-instrument
OTEL_EXPORTER_OTLP_ENDPOINT=https://your-openobserve-url/api/your-org
OTEL_EXPORTER_OTLP_PROTOCOL=http/protobuf
OTEL_EXPORTER_OTLP_HEADERS=Authorization=Basic%20YOUR_BASE64_CREDENTIALS
OTEL_SERVICE_NAME=adot-lambda-demo
OTEL_TRACES_EXPORTER=otlp
OTEL_PROPAGATORS=tracecontext,baggage
OTEL_LOGS_EXPORTER=none
OTEL_METRICS_EXPORTER=none
For the OTEL_EXPORTER_OTLP_HEADERS value, you need base64 encoded credentials:
default for self-hosted)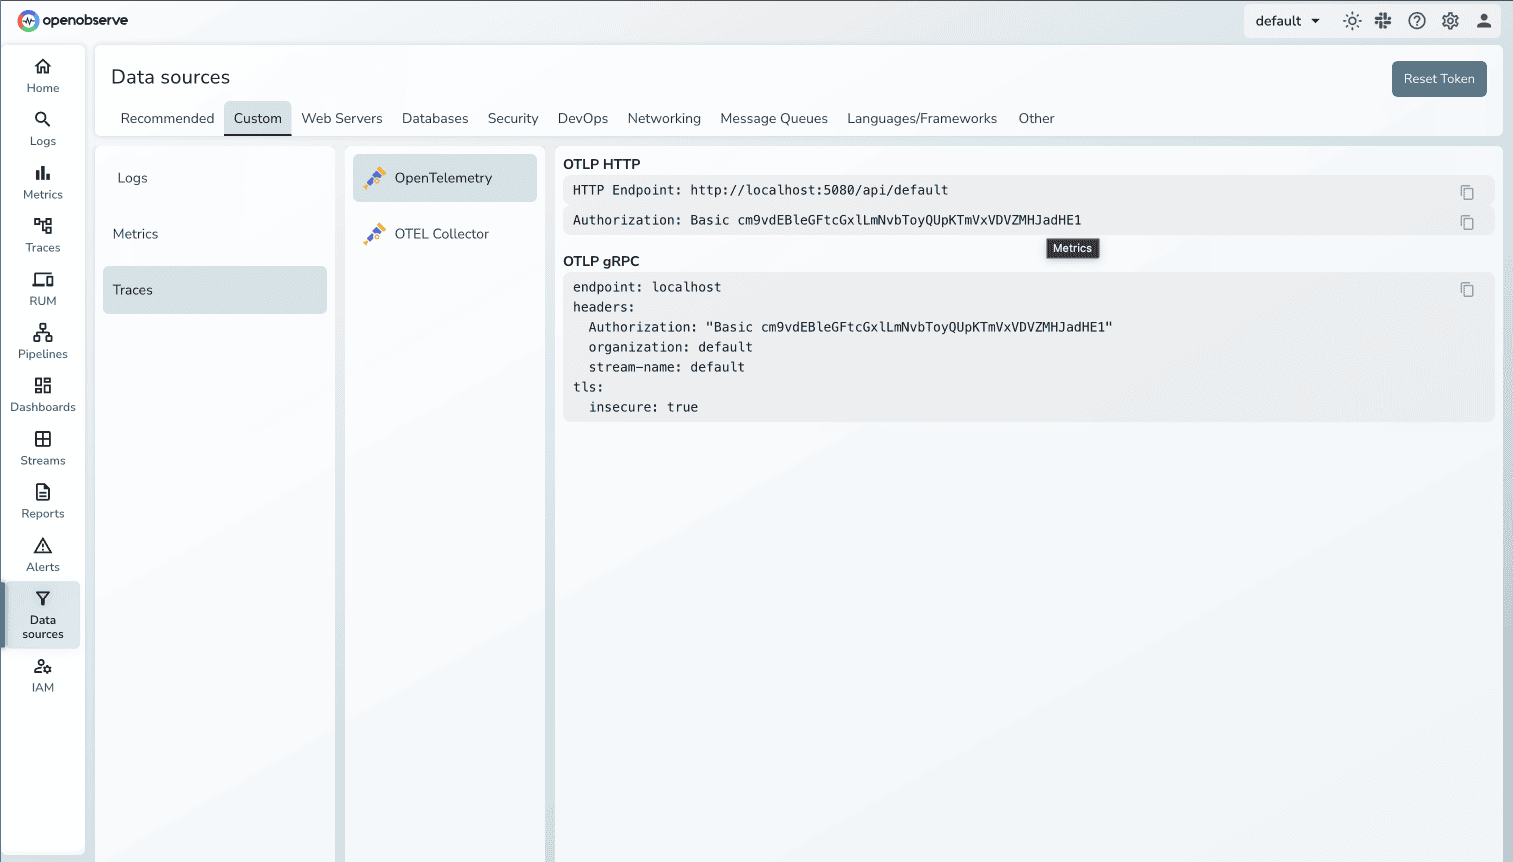
Use this in the authorization header with %20 (URL-encoded space) after "Basic":
Authorization=Basic%2o`your-auth-token`
AWS_LAMBDA_EXEC_WRAPPER: Tells Lambda to execute your handler through the ADOT wrapper at /opt/otel-instrument, which initializes OpenTelemetry before your code runs.
OTEL_EXPORTER_OTLP_ENDPOINT: Base URL where ADOT sends traces. ADOT automatically appends /v1/traces to this path. For example, if you set https://your-instance.com/api/default, traces are sent to https://your-instance.com/api/default/v1/traces.
OTEL_EXPORTER_OTLP_PROTOCOL: Specifies http/protobuf to use Protocol Buffers over HTTP for efficient binary encoding.
OTEL_SERVICE_NAME: Identifies your service in distributed traces. This appears as the service name in OpenObserve's service topology.
OTEL_LOGS_EXPORTER and OTEL_METRICS_EXPORTER: Set to none to focus on traces only and reduce overhead.
Invoke your Lambda function through the AWS Console test feature or using the AWS CLI. The function should execute successfully and return:
{
  "statusCode": 200,
  "body": "{\"message\": \"Lambda executed successfully!\", \"trace\": \"Check OpenObserve for spans\"}"
}
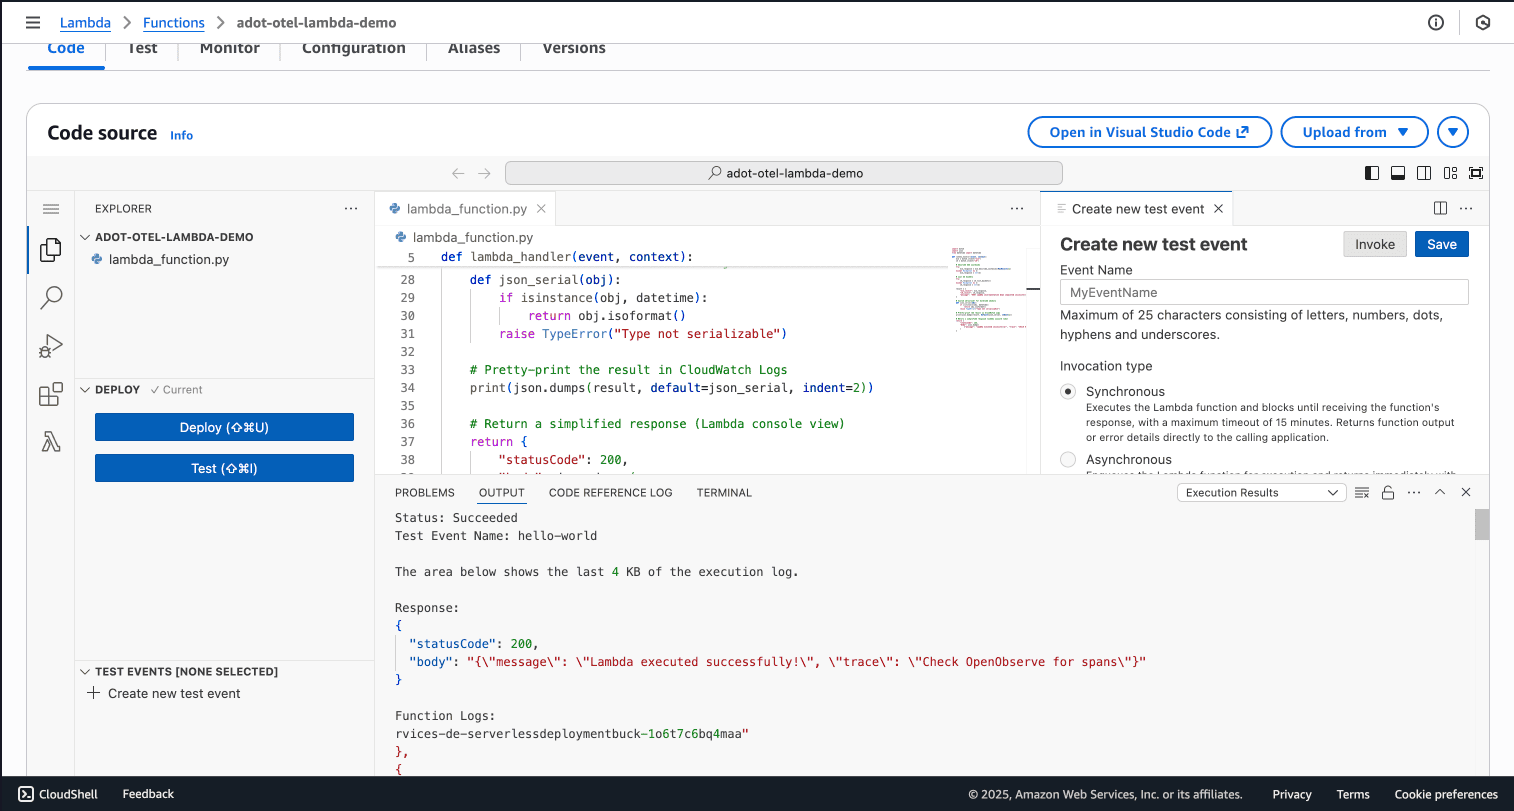
You should see your function's output without errors about trace export. If you see export errors, proceed to the troubleshooting section below.
Error in CloudWatch Logs:
[ERROR] Failed to export batch code: 401, reason: Unauthorized Access
Solution: Check your credentials format in OTEL_EXPORTER_OTLP_HEADERS.
The space between "Basic" and your base64 string must be URL-encoded as %20:
Authorization=Basic%20YOUR_BASE64_STRING
Regenerate your base64 credentials ensuring you use the correct email and passcode:
echo -n "correct-email@domain.com:correct-passcode" | base64
Test credentials outside Lambda:
curl -X POST "https://your-openobserve-url/api/your-org/v1/traces" \
  -H "Authorization: Basic YOUR_BASE64_STRING" \
  -H "Content-Type: application/json" \
  -d '{"resourceSpans":[]}' \
  -v
A successful test returns HTTP 200 with {"partialSuccess":null}.
Error in CloudWatch Logs:
[ERROR] Failed to export batch code: 404, reason: 404 Not Found
Solution: Verify your OTEL_EXPORTER_OTLP_ENDPOINT path.
It should be:
https://your-openobserve-url/api/your-org
NOT:
https://your-openobserve-url/api/your-org/v1/traces
ADOT automatically appends /v1/traces. If you include it, the final URL becomes invalid.
Error in CloudWatch Logs:
[ERROR] urllib3.exceptions.ConnectTimeoutError: Connection to <host> timed out
Causes and Solutions:
If your Lambda is in a VPC, ensure the VPC has a NAT Gateway for internet access and security groups allow outbound HTTPS (port 443).
Verify you're using a publicly accessible OpenObserve URL, not internal DNS names.
Check the endpoint URL for typos in the domain name.
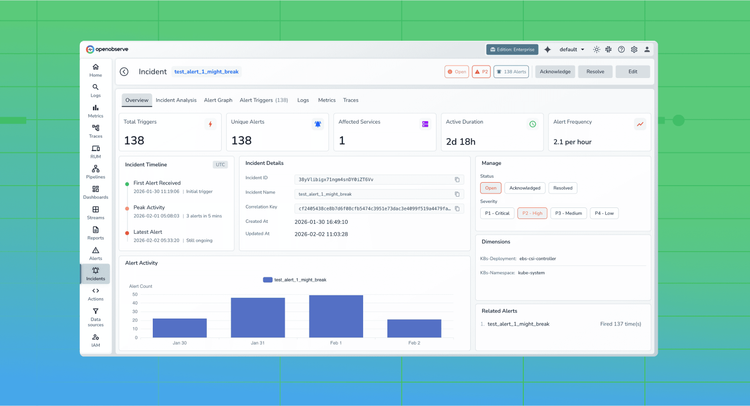
Once your Lambda function exports traces successfully, view them in OpenObserve:
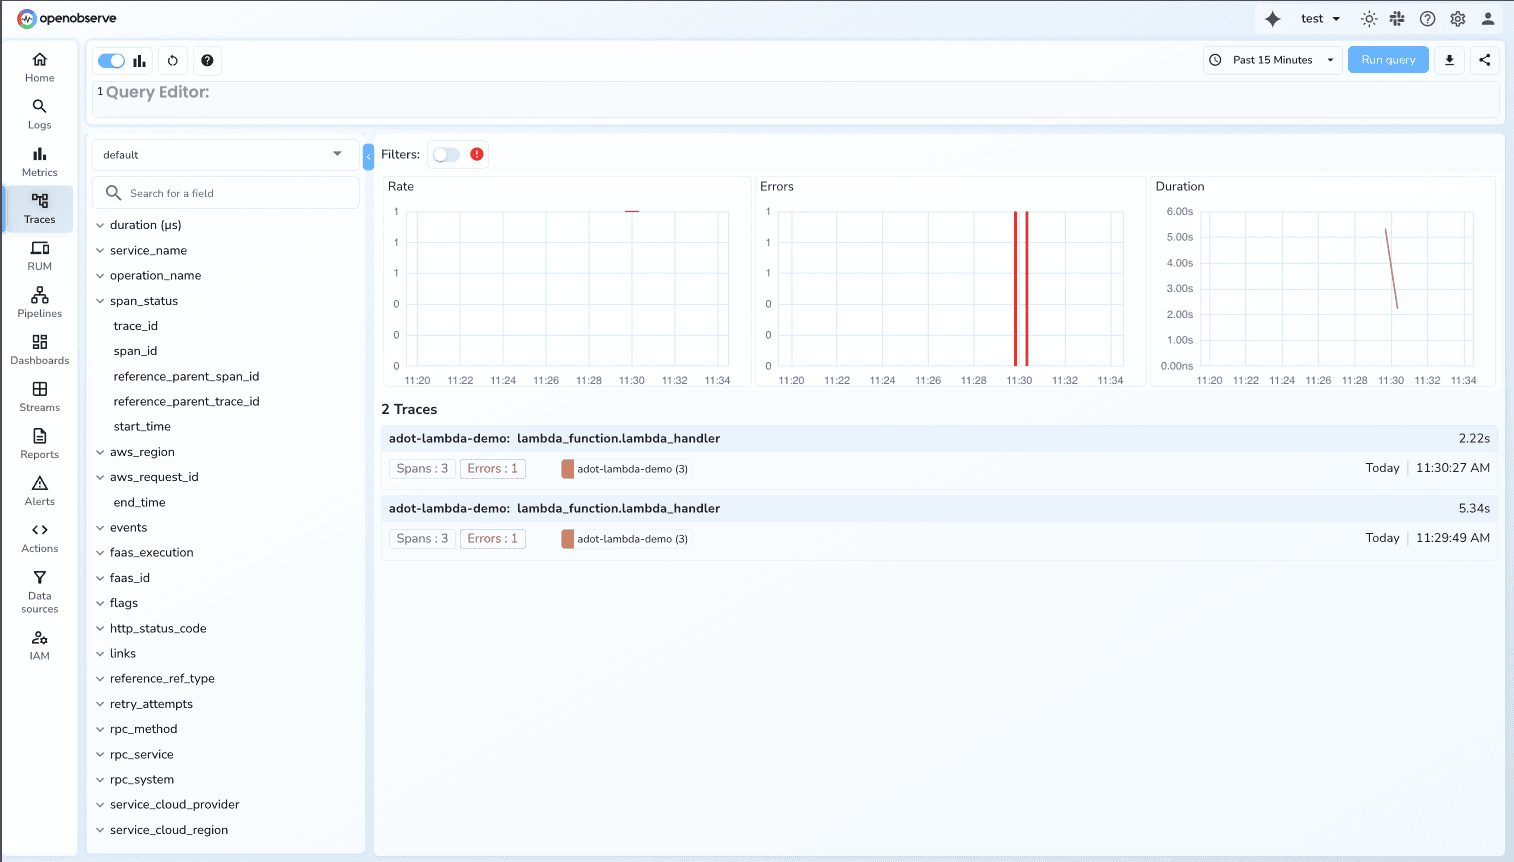
Each Lambda invocation creates a trace with multiple spans:
Root Span: Represents the entire Lambda function execution with your service name (adot-lambda-demo) and operation name (lambda_handler).
Child Spans: Represent individual AWS SDK calls like EC2.DescribeInstances and S3.ListBuckets.
Click on a trace to view the detailed timeline showing the parent/child relationship and latency breakdown.

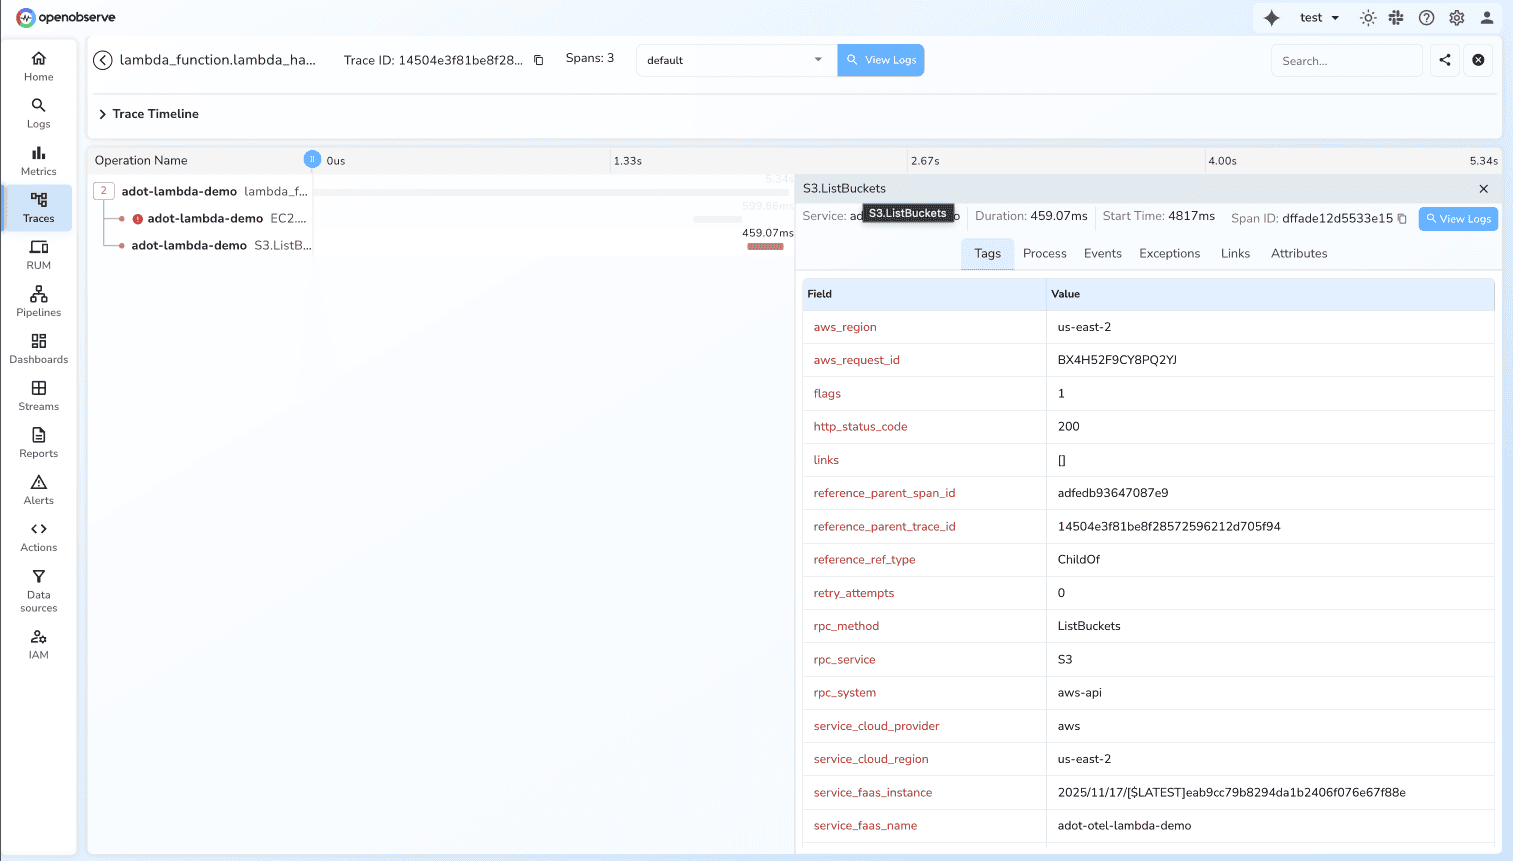
The intentional MaxResults=1 error in the EC2 call appears as a span with error status. Click on the EC2.DescribeInstances span to see rich metadata including:
rpc_system: aws-api
rpc_service: EC2
rpc_method: DescribeInstances
span_status: ERROR
status_message: ClientError: An error occurred (InvalidParameterValue) when calling
  the DescribeInstances operation: Value ( 1 ) for parameter maxResults is invalid.
  Expecting a value greater than 5.
service_cloud_provider: aws
service_cloud_region: us-east-2
service_faas_name: adot-otel-lambda-demo
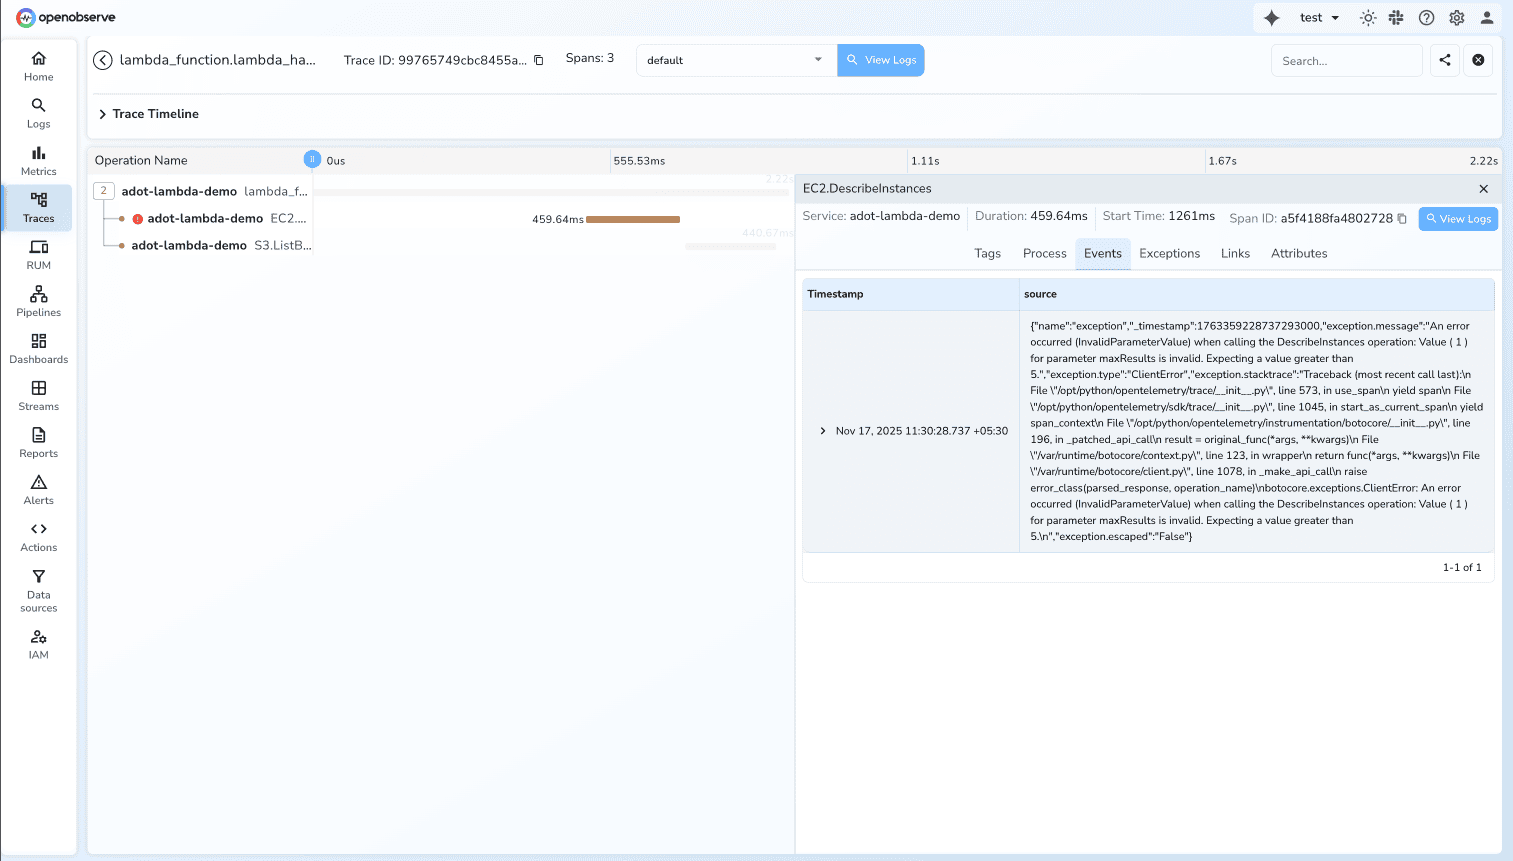
This demonstrates distributed tracing's debugging power. You immediately see which API call failed, the exact error message, and AWS context without manual error handling code.
For more details on OpenObserve's OTLP ingestion and trace querying capabilities, see the official documentation.
You've implemented distributed tracing for AWS Lambda using ADOT and OpenObserve with:
Zero code changes for auto-instrumentation
Detailed traces capturing AWS SDK calls (EC2, S3)
Open standards using OTLP for vendor-neutral observability
Error visibility through rich span attributes
Performance insights into Lambda execution and AWS API latency
This setup provides the foundation for observability in serverless architectures. As you add more Lambda functions or expand to other AWS services, ADOT and OpenObserve scale with you.
Instrument other AWS services: ADOT supports ECS, EKS, and EC2. Check the ADOT documentation for guides on other services.
Enable metrics: Set OTEL_METRICS_EXPORTER=otlp to export Lambda metrics to OpenObserve.
Add custom spans: Use the OpenTelemetry SDK to create manual spans for specific code blocks:
Explore OpenObserve features: Create dashboards, set up alerts based on trace data, and configure retention policies.
Try other languages: ADOT supports Python, Node.js, Java, and .NET. The configuration pattern is similar across runtimes.
The combination of AWS optimized OpenTelemetry (ADOT) and OpenTelemetry native backend (OpenObserve) gives you production grade observability without vendor lock-in or instrumentation complexity.
Get Started with OpenObserve Today! Sign up for a free cloud trial
Manas is a passionate Dev and Cloud Advocate with a strong focus on cloud-native technologies, including observability, cloud, kubernetes, and opensource. building bridges between tech and community.