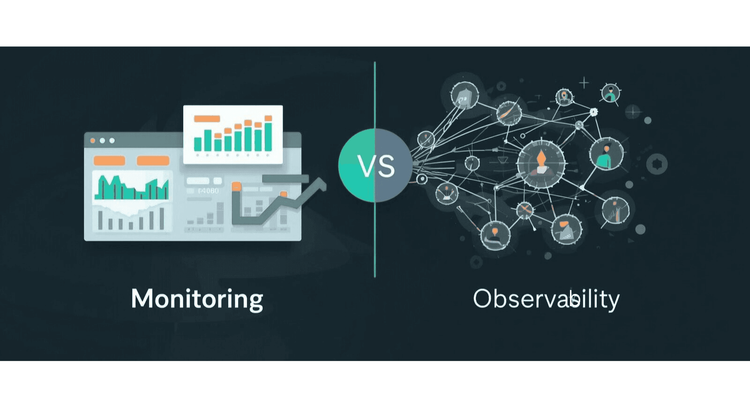
Observability vs monitoring explained. Learn the key differences, use cases, and why modern teams move beyond monitoring to observability.
Explore top New Relic alternatives that offer better pricing, open-source flexibility, and full-stack observability for modern DevOps and SRE teams.
A complete guide to full stack observability - covering frontend, backend, infrastructure, traces, logs, metrics, and OpenTelemetry for DevOps and SRE teams.
Discover the top open-source Grafana alternatives in 2026. Compare features like dashboards, alerting, metrics, logs, traces, scalability, and ease of use for modern DevOps teams.
Discover the best Elasticsearch alternatives in 2026. Compare open-source and commercial tools for search, log analytics, and observability. Find cost-effective solutions with our comprehensive guide covering OpenObserve, OpenSearch, Solr, and more.
Discover the best Splunk alternatives in 2026. Compare open-source and enterprise tools for log management, SIEM, and observability. Find cost-effective solutions with our comprehensive guide.
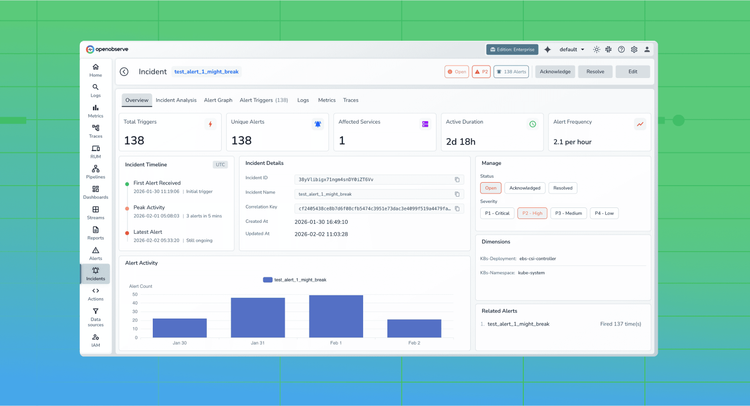
Learn how incident correlation transforms observability by connecting logs, metrics, traces, and alerts into actionable insights. Discover why modern engineering teams rely on correlated telemetry to reduce MTTR and eliminate blind spots in distributed systems.
Compare the top 10 open source APM tools in 2026. Features, pros & cons, tracing, metrics, logs, OpenTelemetry support, and real-world use cases.
Compare the best APM tools in 2026 with real pricing data, technical analysis, and use case guides. OpenObserve delivers 60-90% cost savings with unified observability for logs, metrics, traces, and APM.
Hands-on comparison of DataDog vs OpenObserve pipelines. Explore real-time vs scheduled processing, VRL-based transformations, multi-destination routing, and cost-efficient, unified observability pipelines without extra infrastructure.
Top 10 open source monitoring tools explained. Learn what they are, why they matter, and how to choose to get the most from your observability strategy.
A comprehensive comparison of the top 10 open source observability platforms in 2026 highlighting their strengths, trade-offs, and use-cases.
Compare the best Datadog alternatives in 2026 with real cost data, technical analysis, and migration guides. OpenObserve delivers 60-90% cost savings with unified observability for logs, metrics, and traces.
Hands-on comparison of DataDog and OpenObserve for alerting and monitoring. DataDog's proprietary monitor syntax and per-custom-metric charges vs OpenObserve's SQL-based unified alerts, composite conditions with joins, and Jinja2-templated notifications. Real test data shows custom metric pricing impact on alert coverage versus flat-rate pricing with comprehensive alerting capabilities.
A comprehensive comparison of the top 10 Kubernetes Monitoring tools in 2026 highlighting their strengths, trade-offs, and use-cases.
OpenObserve v0.40.0 comes just in time for the new year, a milestone release that brings major architectural improvements, powerful new alerting capabilities, enhanced observability features, and significant UI/UX refinements. This release represents months of work focused on making OpenObserve more powerful, reliable, and user-friendly.
A comprehensive comparison of the top 10 log monitoring tools in 2025 highlighting their strengths, trade-offs, and use-cases.
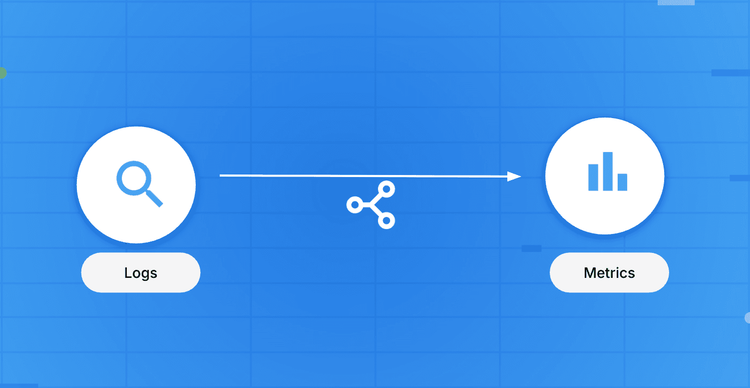
Learn how to convert raw logs into metrics using OpenObserve pipelines. Step-by-step guide to extract time-series metrics for faster dashboards and reliable alerts.
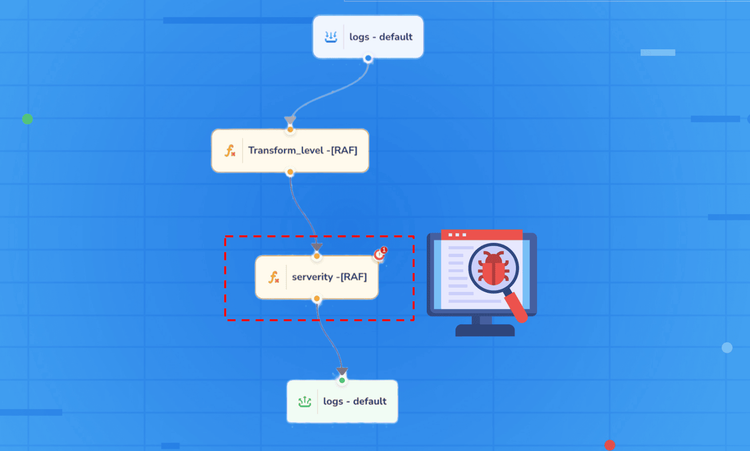
A step-by-step guide to debugging real-time observability pipelines in OpenObserve, covering log ingestion, pipeline errors, and troubleshooting.
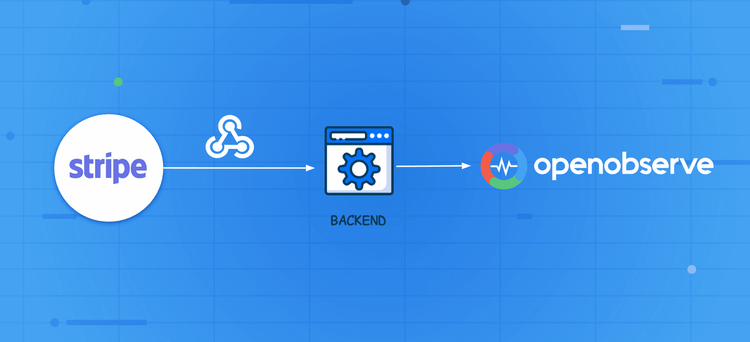
Enable end-to-end payment monitoring by sending Stripe events to OpenObserve and analyzing success/failure rates using dashboards, SQL queries, and alerts.
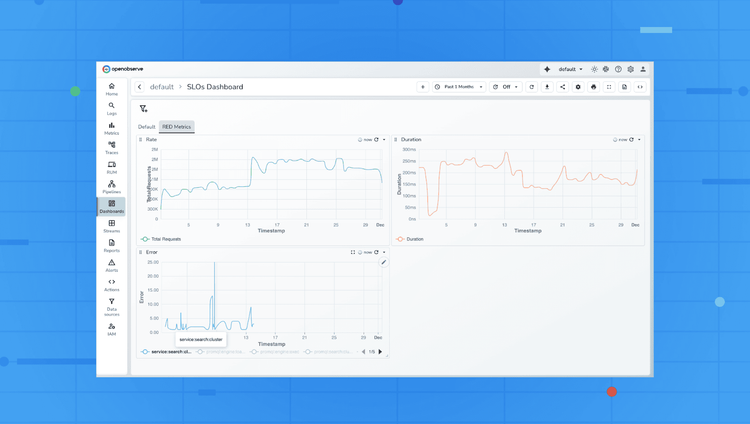
Learn how to use RED Metrics: Requests, Errors, Duration to monitor microservices effectively. Explore dashboards, SLOs, alerts, and OpenObserve examples for real-time observability.