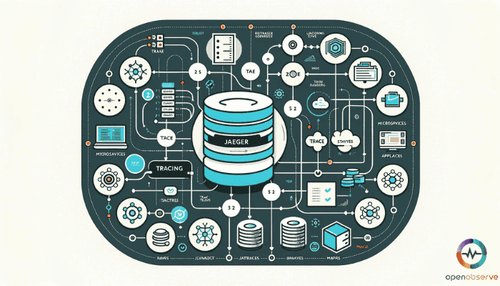
Get started with Jaeger tracing: understand its role in distributed systems and explore the Jaeger UI for better monitoring.
Explore the top open source Splunk alternatives like OpenObserve, SigNoz and Logstash. Compare to find the best fit for your observability needs.
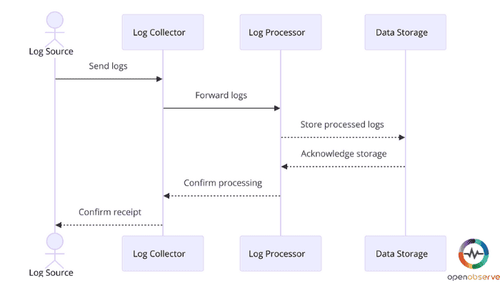
Learn the importance of log ingestion in monitoring and security, handling different types like security, system, and application logs.
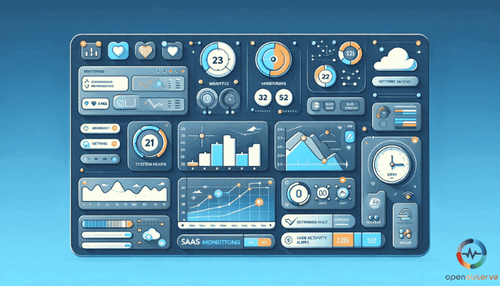
Discover key steps in choosing the right SaaS monitoring tools: consider type of application, performance requirements, and user experience.
Get an overview of SPA Monitoring, its importance in monitoring single page applications, and its eminent advantages for developers.
Our blog compares Zipkin and Jaeger, leading tools for open-source, distributed tracing in modern software development.
Discover top web performance monitoring tools like OpenObserve, Sematext, Pingdom, and Uptime Robot, balancing frequency, coverage, and pricing models.
Unravel the four core Prometheus metric types - Counter, Gauge, Histogram, Summary - their role in system monitoring.
An observability pipeline manages, optimizes, and analyzes telemetry data, enhancing security and operational efficiency with AI-driven enhancements.
Explore IIS Logging, understand its unique role in troubleshooting and optimizing web services, and learn how to configure log file locations.
Our Splunk search tutorial provides step-by-step instructions on creating search queries, refining searches with Boolean operators.
Explore the operational frameworks of OTLP, how it contributes to OpenTelemetry data models, and its evolving nature within the OpenTelemetry project.
Learn the best practices to select web application monitoring tools and their role in detecting issues, quickly resolving them, and ensuring optimal performance.
Learn the essentials of scaling architecture and master principles and best practices for resilient systems.
Uncover osquery, a versatile system monitoring framework that transforms your OS into a queryable relational database, enhancing security and insights.
Boost your website's UX with session replay software. Identify issues, optimize conversions, and enhance support for better performance.
Prometheus vs Grafana: Learn how both of these tools compare in crucial metrics like features, data collection and storage, UI, and more.