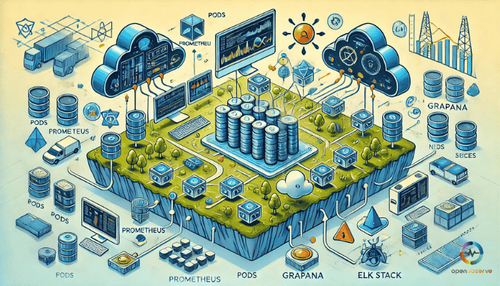
Our blog provides a detailed overview of top open-source log management tools, stressing on their primary features and usability.
Discover the role and setup of SQL Server Receiver within OpenTelemetry for effective monitoring and performance optimization.
Learn the importance of monitoring Oracle DB Receiver in cloud environments and converting query results into actionable metrics.
Discover ways to choose the right web application monitoring tools, monitor user experience, and automate alerts for maximum efficiency.
Learn how to configure Dsquery for effective Active Directory DS Receiver monitoring and schedule regular checks.
Learn the essential steps to enable istio tracing in microservices and how Istio’s Envoy proxy generates and propagates tracing headers.
Discover key methods for monitoring Kubernetes like DaemonSets, Heapster and OpenTelemetry for consistent, comprehensive telemetry data.
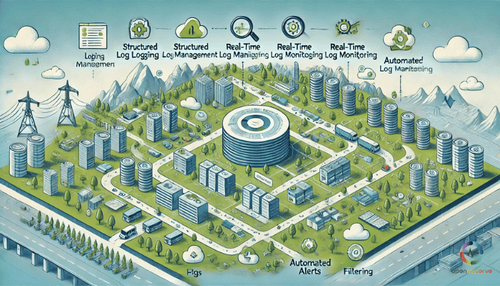
Our blog emphasizes on easier logs management and troubleshooting practices like defining clear logging objectives and structured logs.
Understand the top 10 observability best practices, including monitoring critical events, standardized data logging, and effective feedback loops.
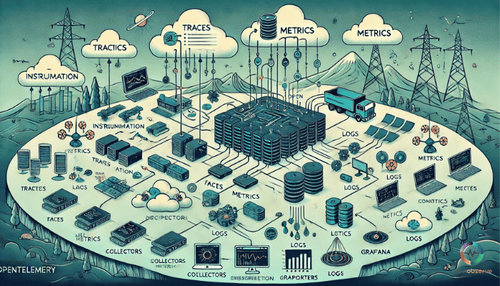
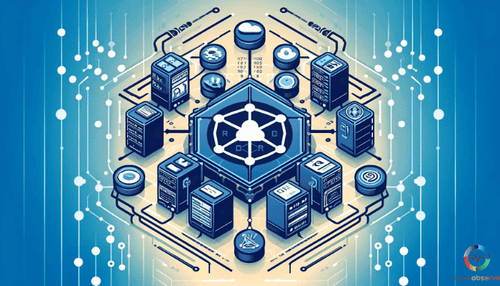
Explore OpenTelemetry architecture, its key components and signals including data collection, processing, and context propagation.
Learn how to configure Kafka to report metrics to the OpenTelemetry Collector in our in-depth guide for Kafka metrics receiver.
Receives spans from Zipkin (V1 and V2). Include the Zipkin receiver in the receiver definitions.
Dynatrace works by automatically monitoring applications and infrastructure, tracking transactions from browser to database, and examining performance issues.
OpenTelemetry, an effective observability framework for telemetry data in Node.js applications - tracing, metrics, and logs.
K8s Cluster Receiver is instrumental in aggregating cluster-level metrics and events for efficient Kubernetes monitoring.
Metrics is a numeric representation of data over time, providing essential insight into system performance within observability.
Get an overview of OpenTelemetry Collector's data processing capabilities, its key components like receivers, processors, exporters and extensions.
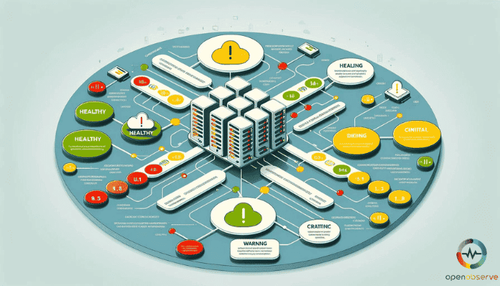
Elasticsearch cluster health is significant. It has 3 status colors: green, yellow, red, depicting shard allocation.
Explore the three pillars of observability—logs, metrics, and traces. Learn how they interact to provide deep system visibility and drive performance.
Cloud scalability offers cost efficiency, improved performance, enhanced reliability, and robust disaster recovery essential for organizational growth.
RUM captures user interaction metrics for proactive issue resolution and digital performance improvement. Understand Real User Monitoring.