Overview of the role of open source log management and monitoring for system health. Key tools for 2024 include Graylog, Logstash.
Get the top APM metrics to enhance application performance including CPU usage, average response time, error rates and throughput.
Explore the benefits and components of Syslog servers, how they work, and the importance of log management for system diagnostics.
Get started with OTEL collector: setup the environment, generate and collect telemetry, explore components, and apply custom configurations.
The blog discusses the importance of data monitoring tools in enhancing user experience and reducing IT costs.
Distributed Tracing provides comprehensive visibility into requests across services, helping to identify sources of errors and latency.
Discover how APM tools combat challenges digital teams face, enhancing app performance for businesses and customers.
Explore how OpenTelemetry works, providing standardized collection and analysis of telemetry data like logs, metrics, and traces.
Explore how integrating NGINX Receiver with OpenTelemetry Collector offers enhanced observability solutions.
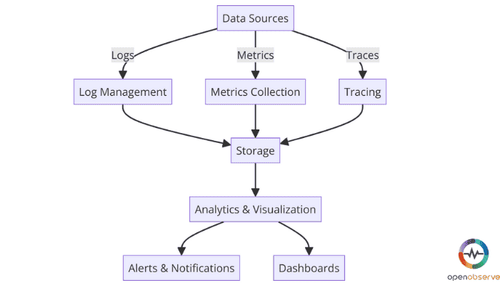
The blog discusses the observability stack, its core pillars and the importance of telemetry data in system performance.
Learn how to optimize asset performance using Prometheus and OpenObserve for real-time monitoring and dynamic dashboard visualization
Unlock advanced data insights in Splunk with 'group by' for multiple fields.
Explore the unique benefits of Datadog APM for optimizing app performance, resource usage, and security.
Explore top continuous testing tools and learn how observability transforms incident management.
Simplify Grafana deployment in Kubernetes with Helm Charts. Gain insights & manage data visualizations effectively
Discover top IT and infrastructure monitoring tools for 2024, comparing features, usability, and integration capabilities.
The blog post explains how to configure Prometheus Receiver with OpenTelemetry Collector to collect and monitor metrics.
Explore simplified JMX metric collection and precise metric selection with the OpenTelemetry Java agent's JMX Receiver integration.
Learn about the Prometheus agent mode, a solution for efficient metric shipping at remote locations, with improved scalability and performance.
Learn how security observability enhances understanding and incident detection, contributing to robust threat protection in cybersecurity.
Dive into the top open source distributed tracing tools, exploring their features, case uses, and benefits for microservices.