Frontend Monitoring enhances user experience by monitoring interactions between frontend and backend systems, crucial for application health.
Explore the importance of open source solutions in enhancing data observability compared to vendor-managed counterparts.
Enterprise observability plays a key part in offering insight into complex IT environments and strategies for modern IT management.
This blog introduces the OpenTelemetry Collector for Memcached and details the data collection process for effective Memcached monitoring.
The role of OTEL collector receivers in capturing and processing SNMP traps for efficient network management.
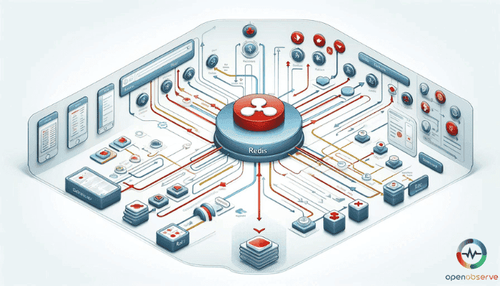
The blog discusses otel-collector redis receiver's deployment, configuration, and metrics, such as memory used and commands processed for enhanced monitoring.
Dive into the essentials of microservices monitoring tools, covering prominence of observability, alert balance and performance identification.
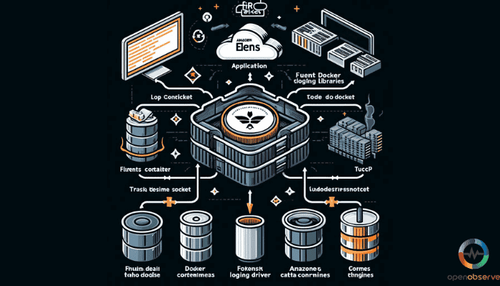
FireLens is a log router for Amazon ECS that offers direct streaming to destinations like Amazon CloudWatch and simplifies log filtering.
Learn how to use 'kubectl logs -f -c' for real-time log streaming and manage Kubernetes logs efficiently.
Discover the importance of unified observability and troubleshooting for cloud-based applications using observability dashboards.
Discover the power of real-time Nginx monitoring with NGINX Plus, streamline configurations, manage upstream servers, and optimize traffic analysis.
Discover Elasticsearch Match Query's capabilities handling text, numbers, dates, and boolean values for precise and fuzzy searches.
Harness the power of Elasticsearch on Azure with our comprehensive deployment guide. Learn to set up, manage, and optimize your cluster for real-time search and analytics.
Through logs, metrics, and traces, microservices observability manages the complexities of architecture for reliable, high-performance applications.
Uncover top open source logging tools of 2024, with a focus on flexibility, cost-effectiveness, comprehensive features, and support.
Unveil the role and benefits of JavaScript Logging in web development and Agile methods, highlighting the distinction in client-server logging tactics.
The blog discusses building an open source observability platform, highlighting key tools like Prometheus, Loki, and OpenTelemetry.
Learn about the pull-based model for metrics collection pivotal to Prometheus architecture and its components like Server, Exporters, Alertmanager.
Explore key Kafka monitoring metrics, tools and best practices from industry experts for optimized performance and seamless data streaming.
Explore the difference between monitoring and observability and learn how they work together to optimize system performance and reliability.
Learn about open source APM tools, their key features, benefits, and how they compare to commercial APM solutions.