


Metrics
OpenObserve provides comprehensive metrics collection, storage, and visualization capabilities for monitoring your applications and infrastructure performance in real-time.
Overview
Metrics in OpenObserve enable you to track key performance indicators, monitor system health, and gain insights into your application's behavior over time. Designed for high-throughput environments, OpenObserve efficiently handles metrics ingestion, storage, and querying at scale while maintaining cost-effectiveness.
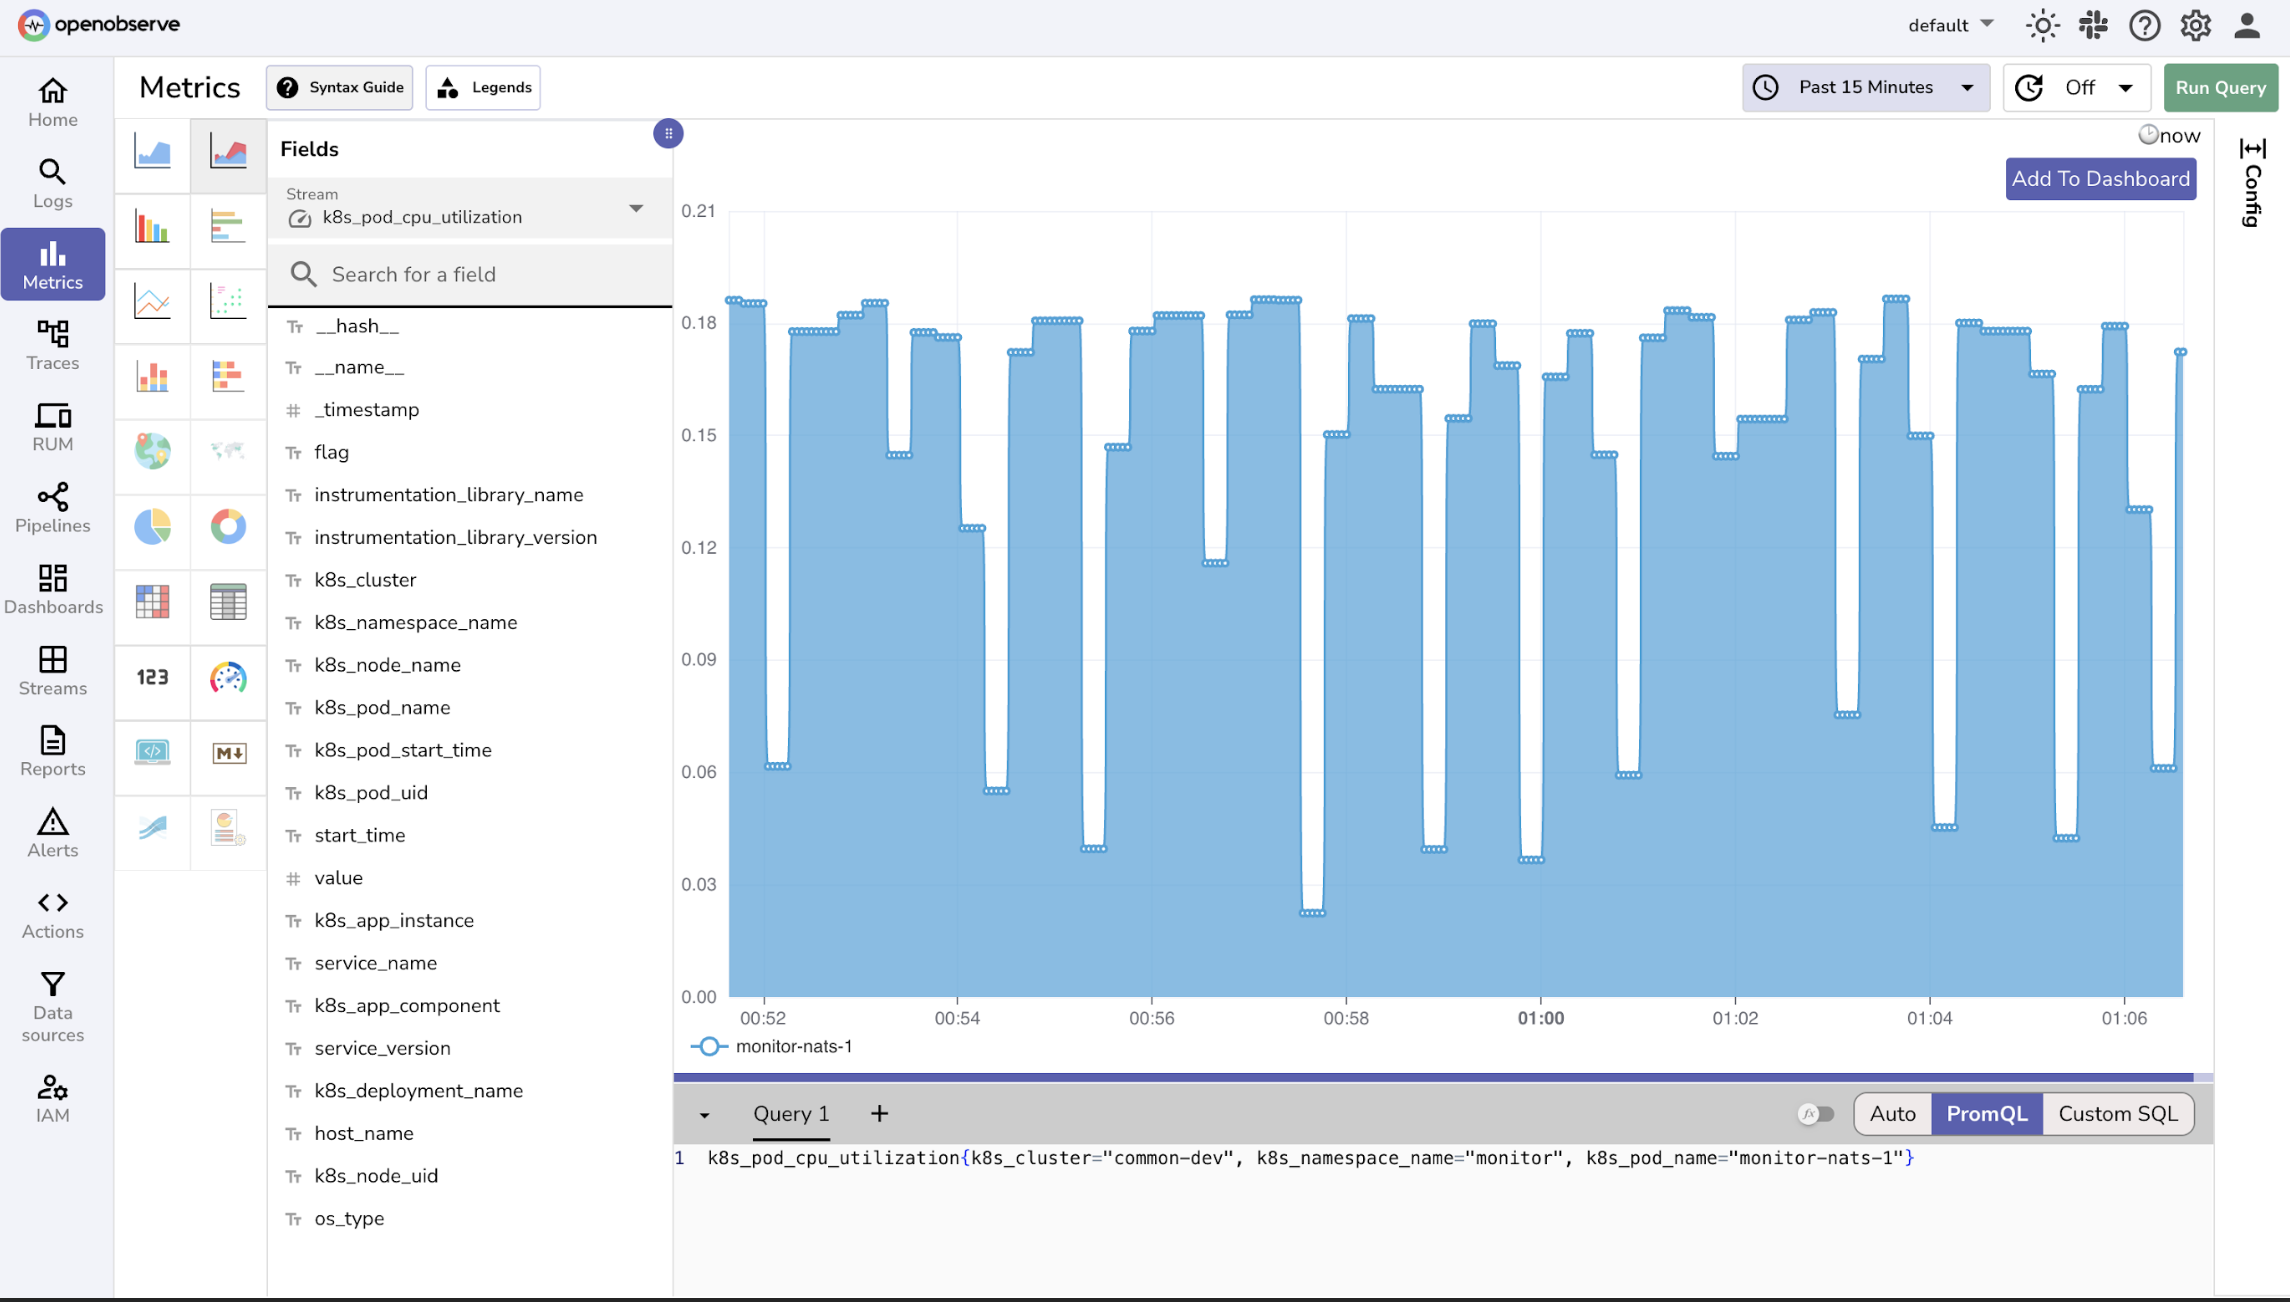
Key Features
Metrics Ingestion
- Multiple Formats: Support for multiple formats including Prometheus remote-write and structured JSON metrics via HTTP ingestion.
- Push & Pull Models: Supports push-based ingestion and integration with systems like Prometheus for pull-based scraping.
- High Throughput: Handle millions of metrics per second with minimal latency.
- Optimized Processing: Optimized ingestion pipelines for high-throughput environments.
Metric Structure
- Time Series Data: Native support for time-series metrics with timestamp precision.
- Multi-dimensional: Handle metrics with multiple labels and dimensions for detailed analysis.
- Aggregation Functions: Built-in support for common aggregation functions (sum, avg, min, max, count).
- Custom Metrics: Flexible schema for application-specific metrics and KPIs.
Query & Analysis
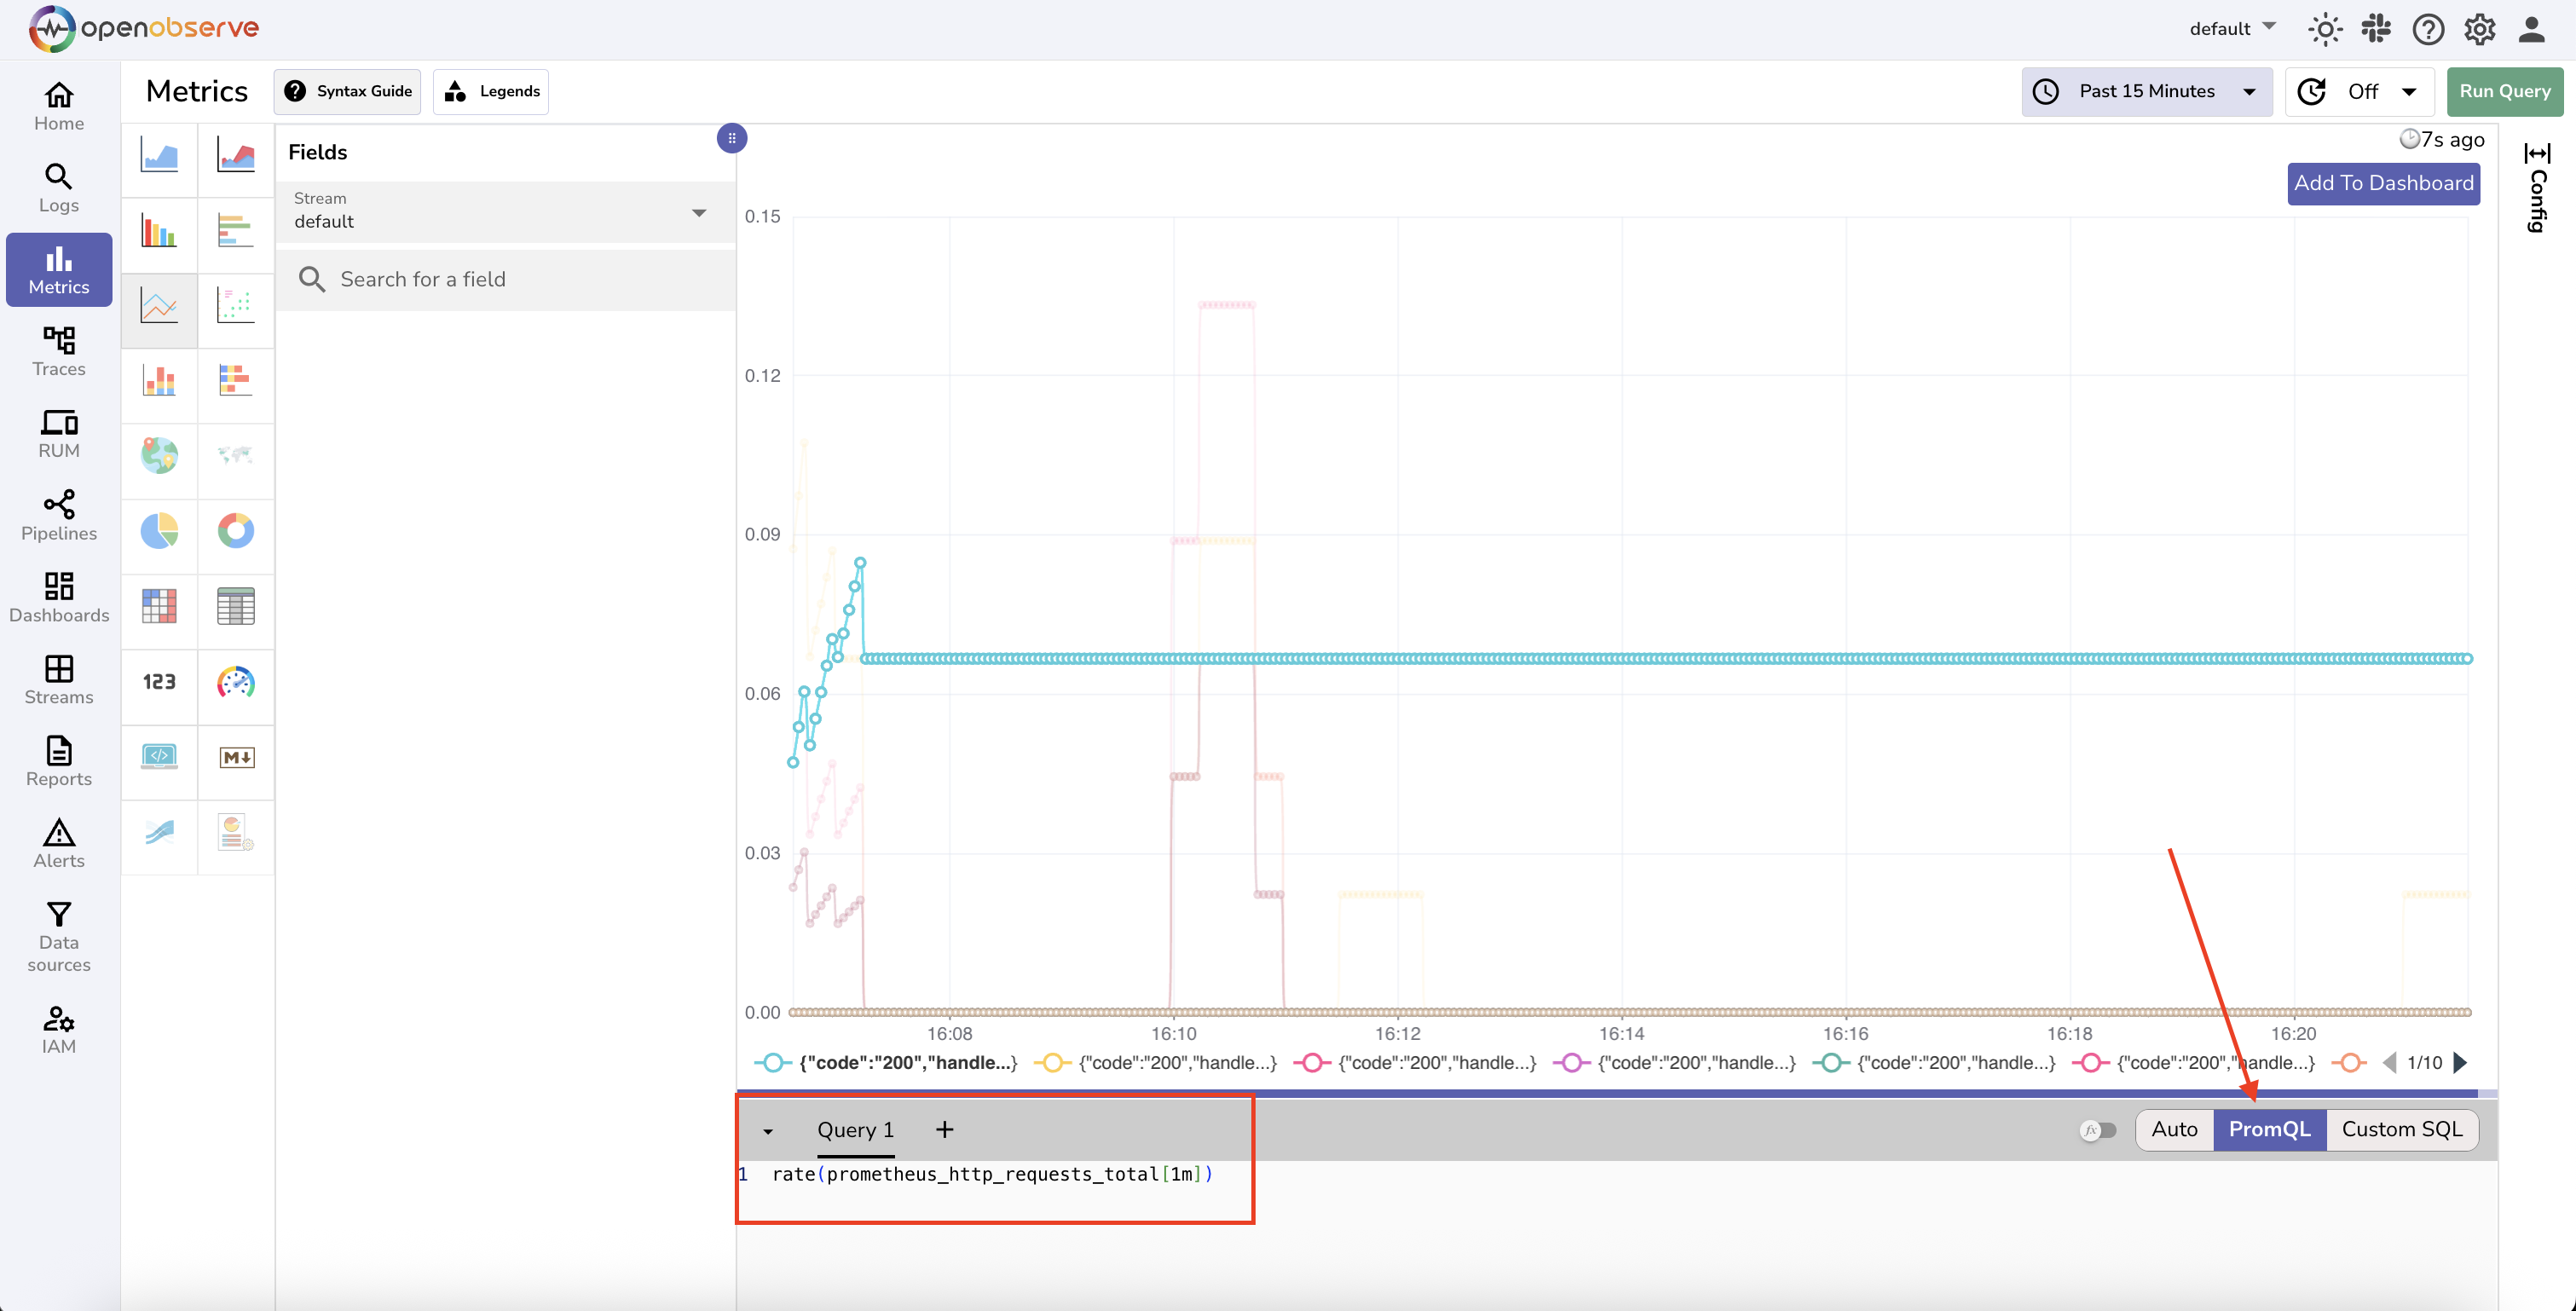
- PromQL Support: Full compatibility with Prometheus Query Language for familiar querying.
-
SQL Interface: Use SQL syntax for complex metrics analysis and reporting.
-
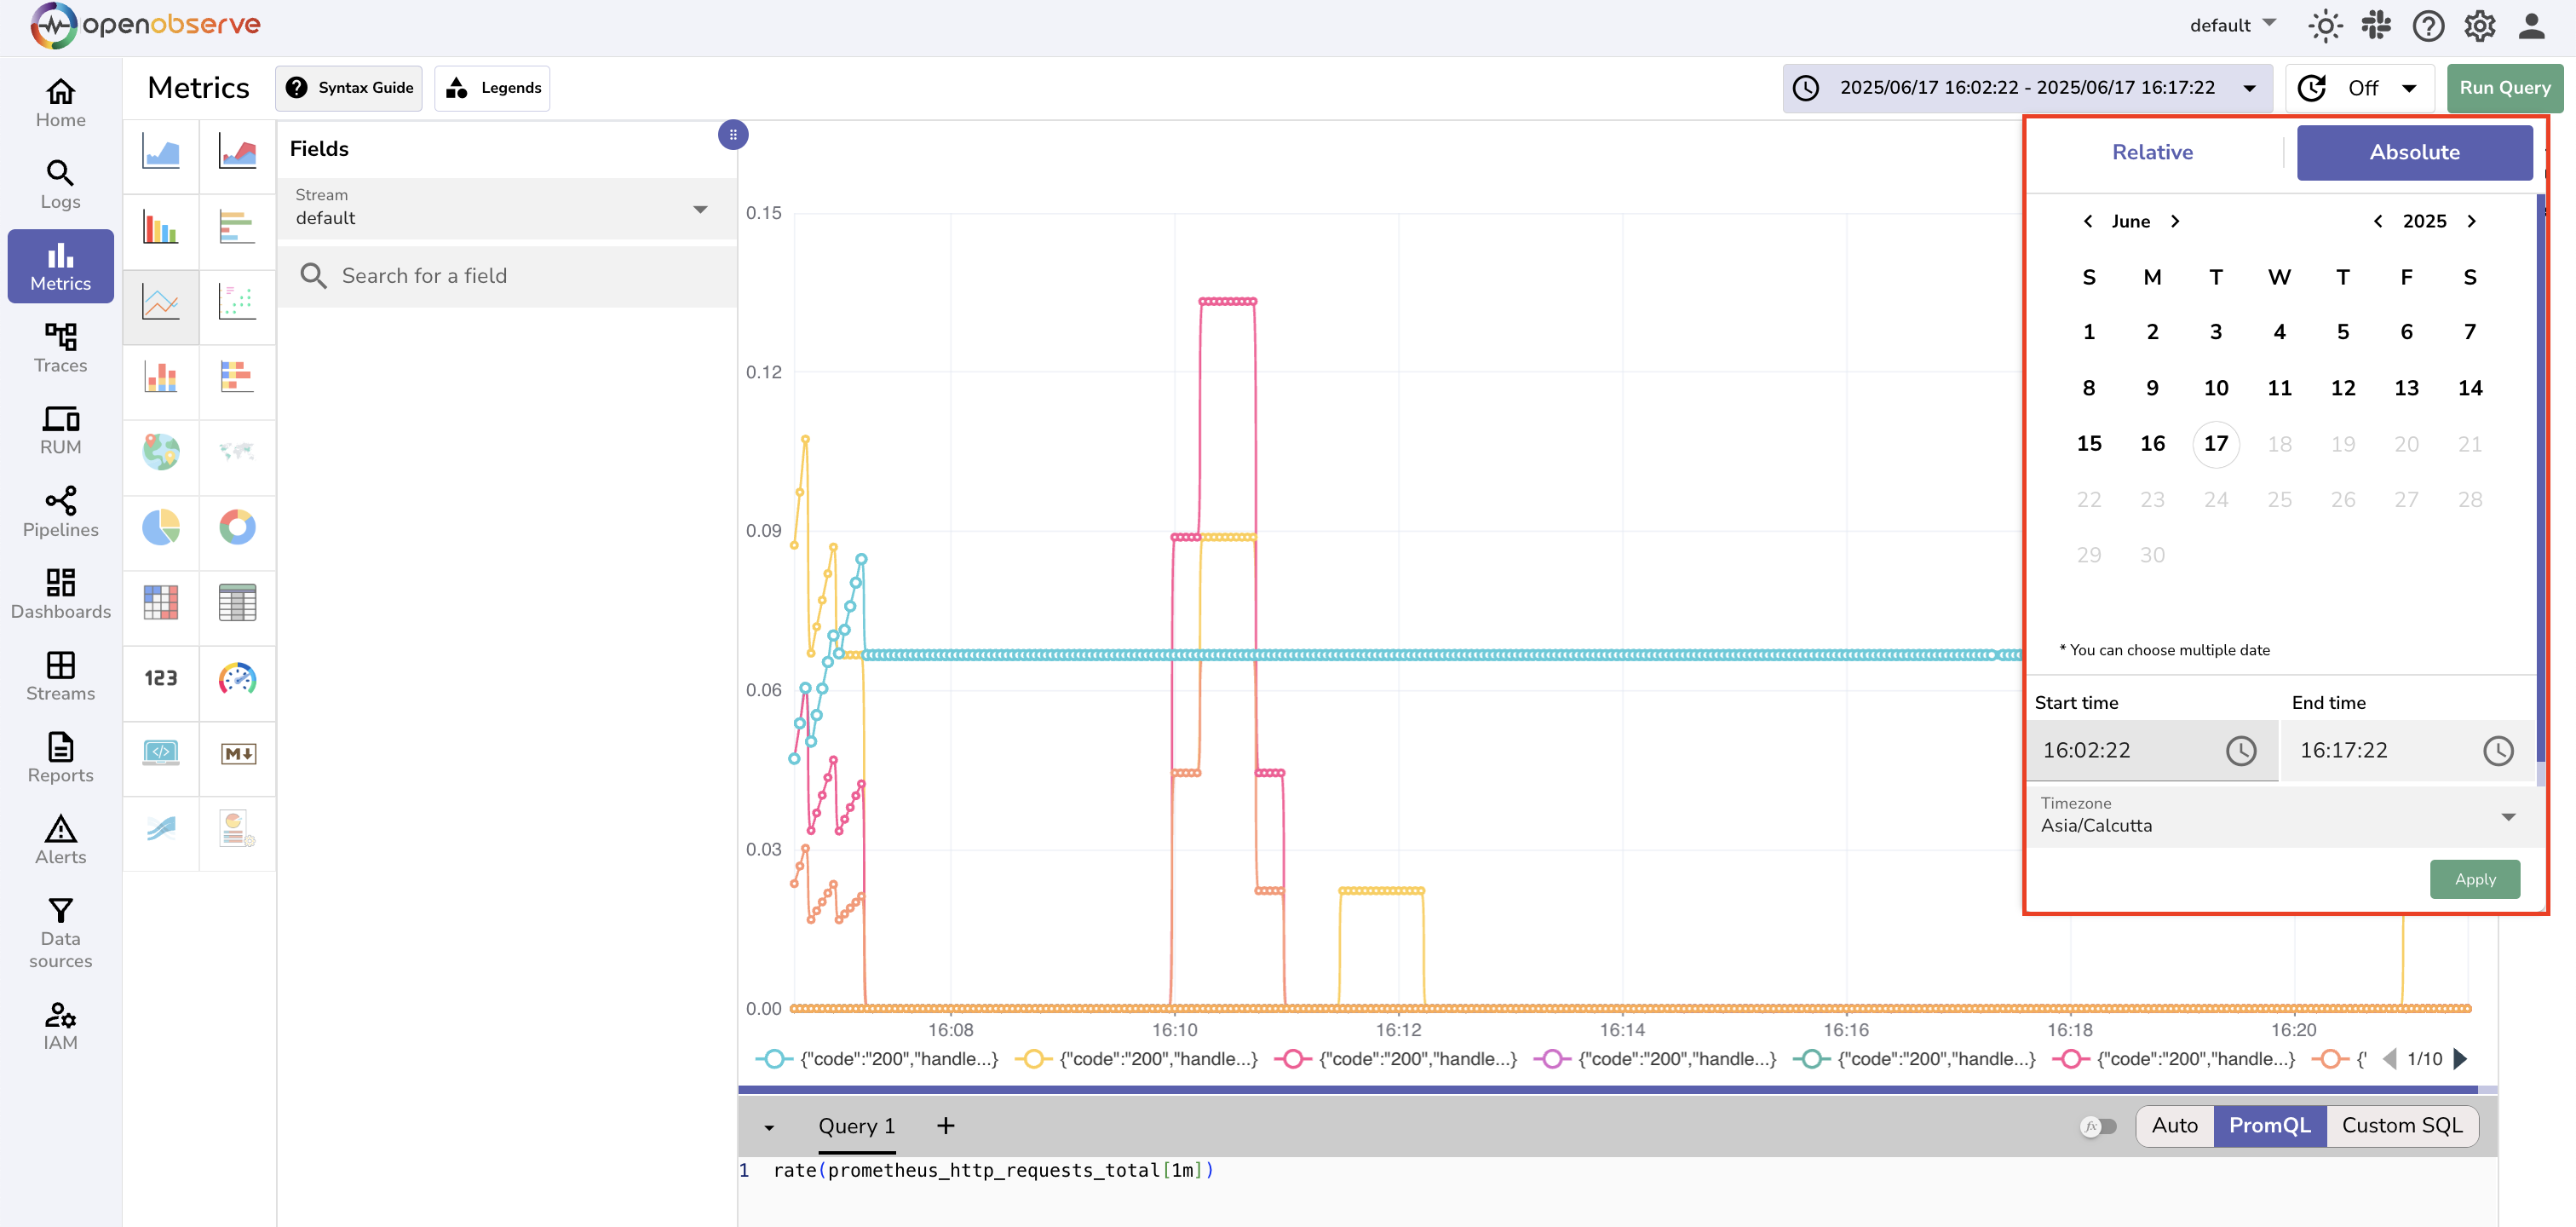
Time Range Selection: Flexible time range queries with support for relative and absolute time periods.
- Mathematical Operations: Perform calculations and transformations on metrics data.
Visualization & Dashboards
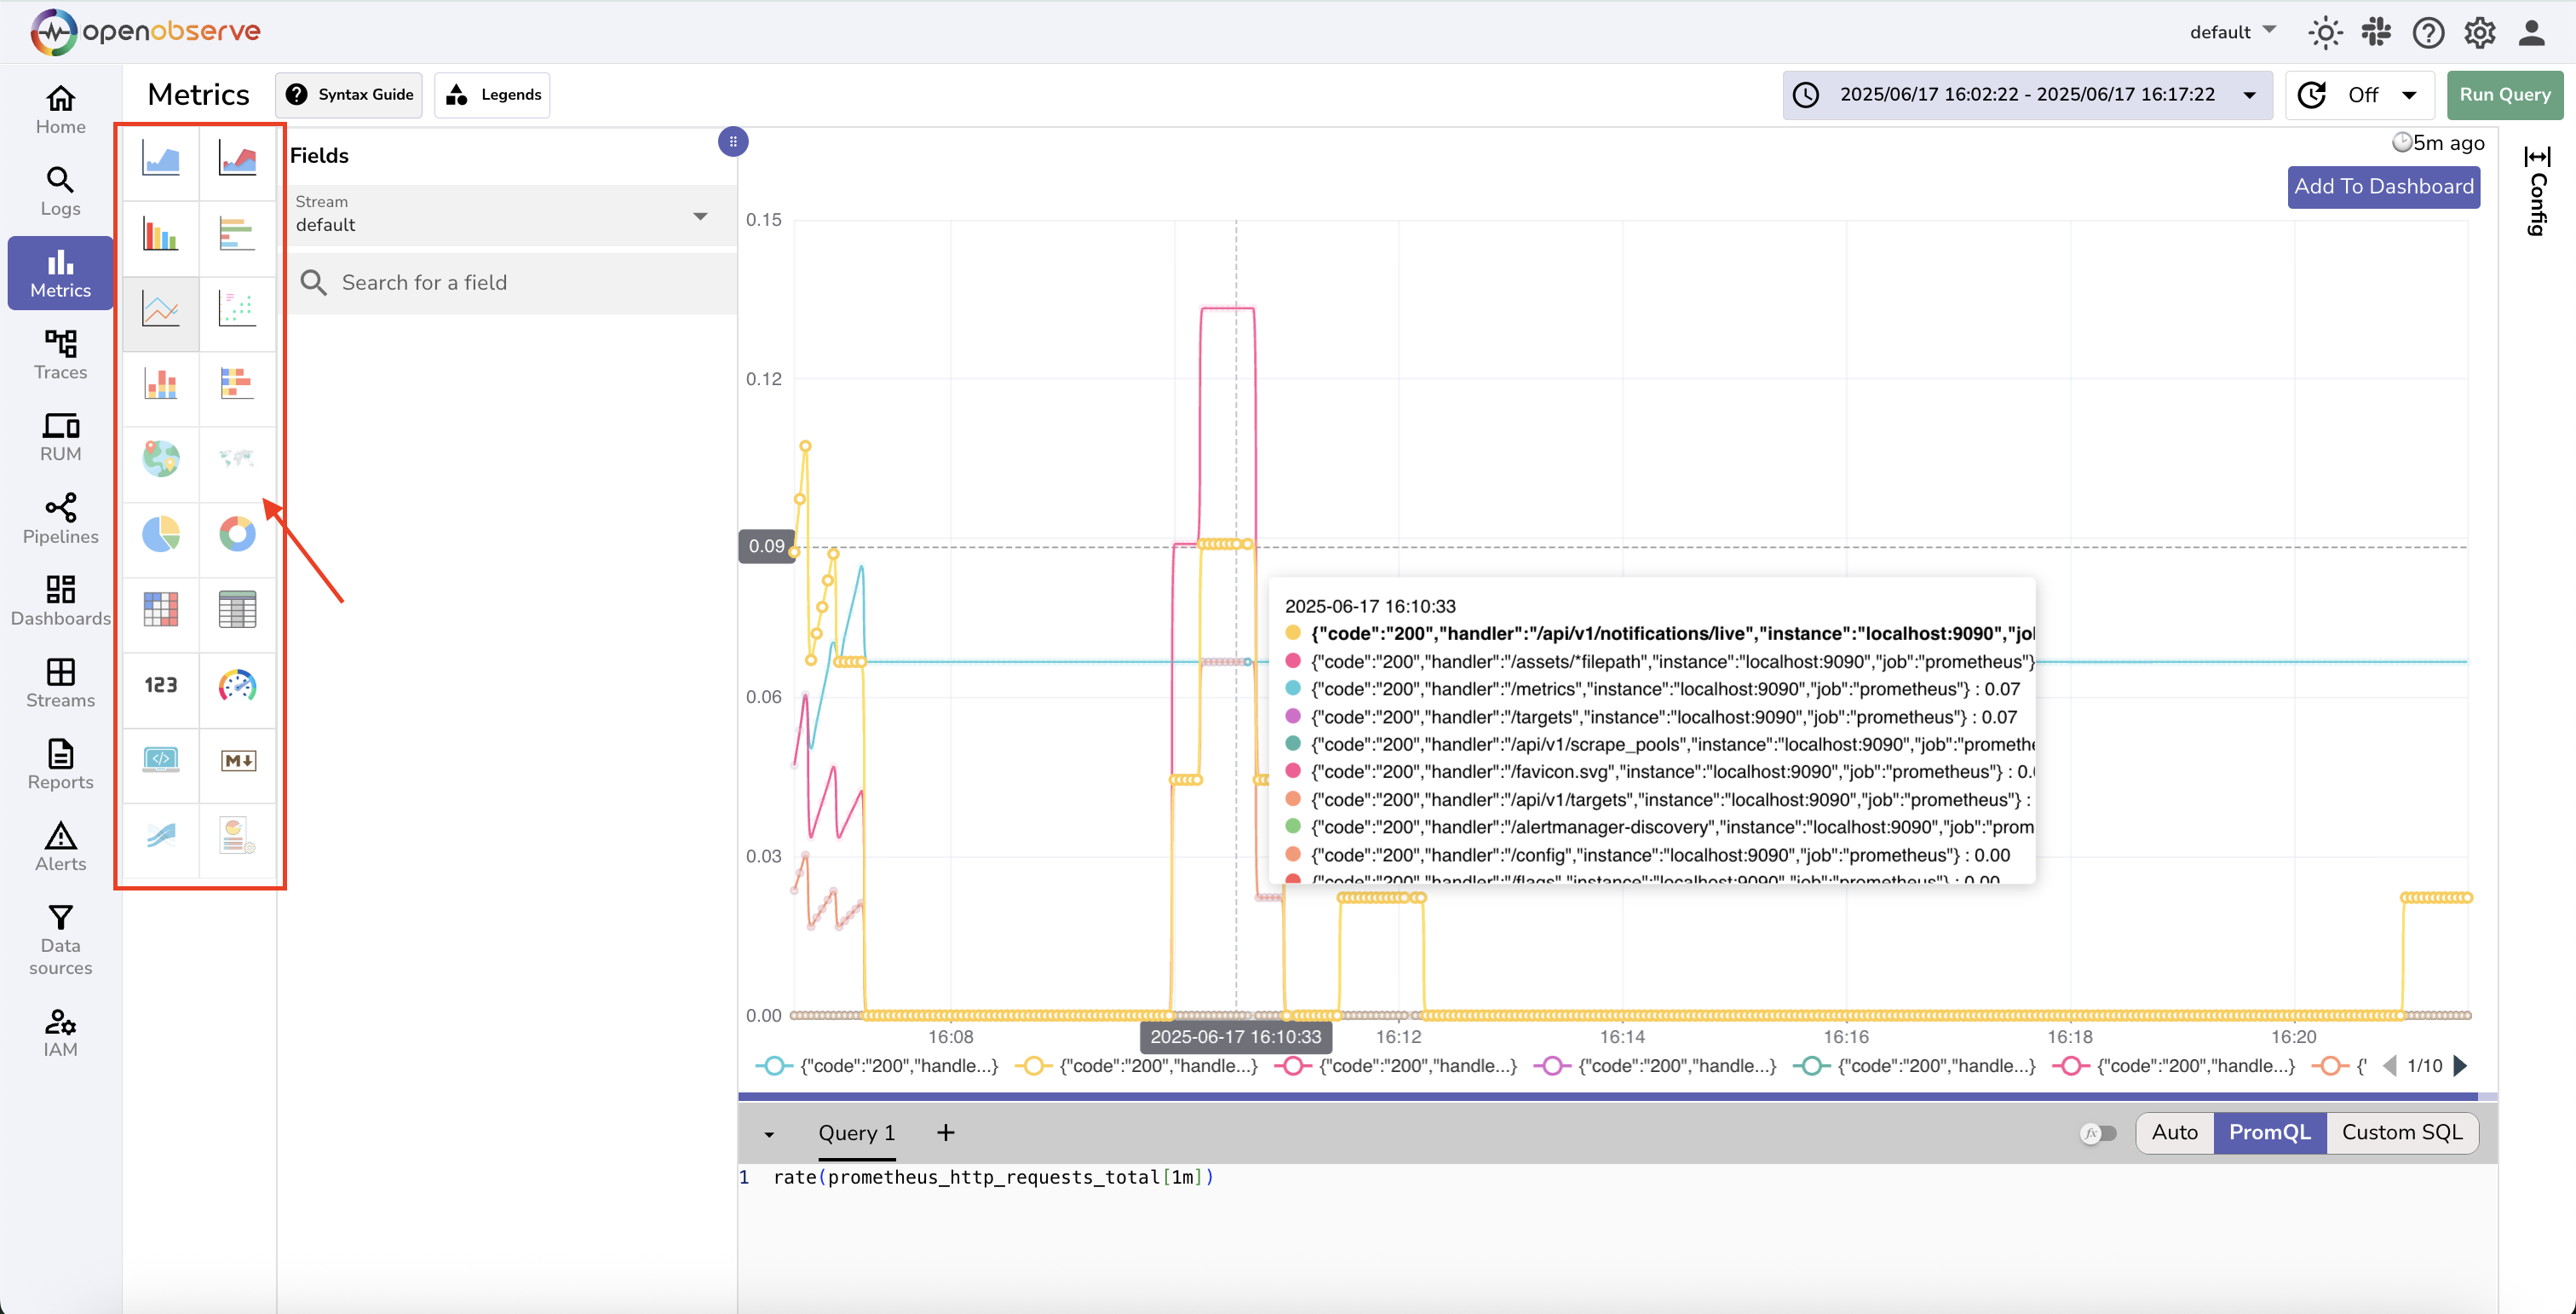
- Real-time Charts: Interactive time-series visualizations with multiple chart types.
-
Custom Dashboards: Create comprehensive dashboards with multiple metrics panels.
-
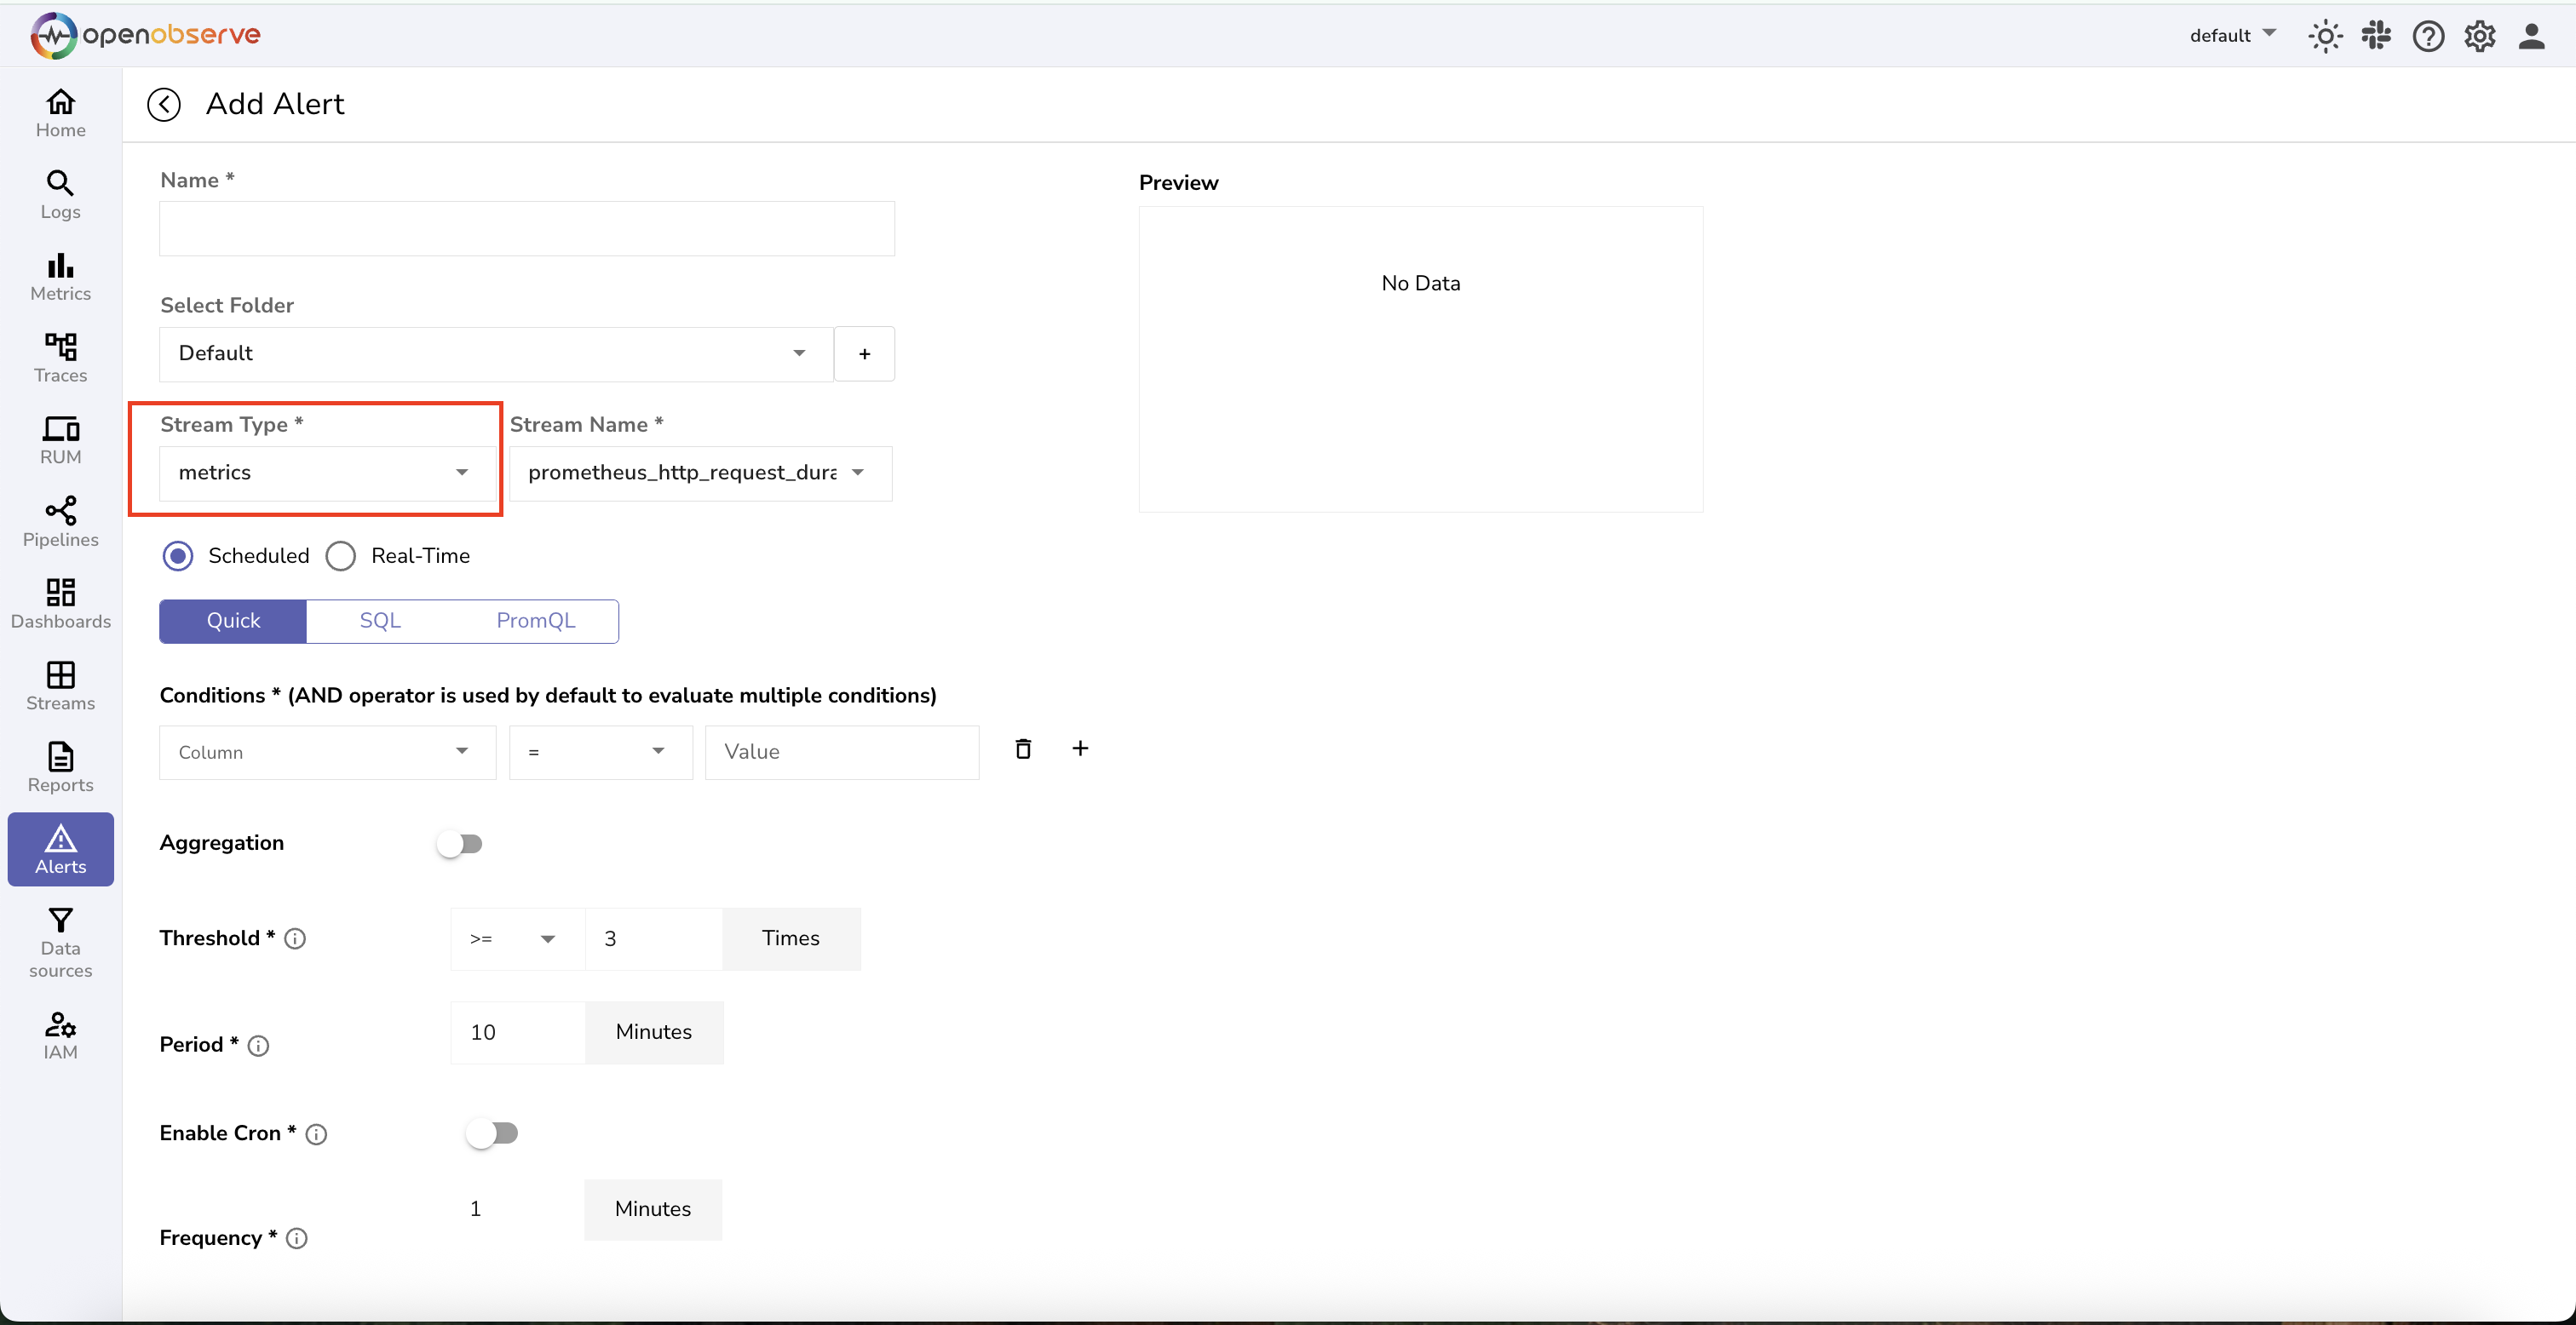
Alerting Integration: Set up alerts based on metrics thresholds and conditions.
- Share Metrics Views: Share an exact metrics view with your team by copying a URL from the Share button in the metrics toolbar. The URL encodes your current panel configuration — chart type, queries (PromQL or SQL), stream selection, time range, and refresh interval — so recipients see the same chart and data. Opening a shared link auto-restores the view and runs the query immediately.
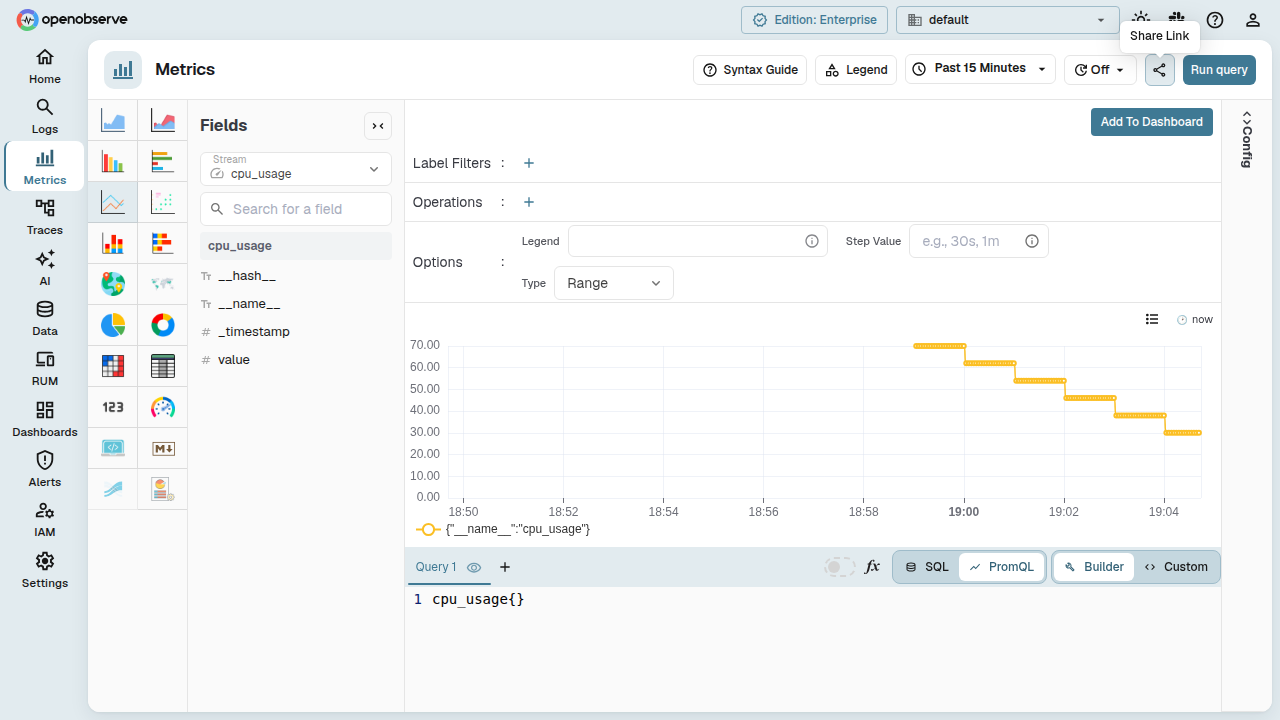
The share URL carries the full panel state as a versioned base64 blob in the metrics_data query parameter. The metrics page also accepts lightweight deep-link overrides (chart_type, query_type, stream_name, query) for programmatic linking from alerts, dashboards, and other pages.
Storage & Performance
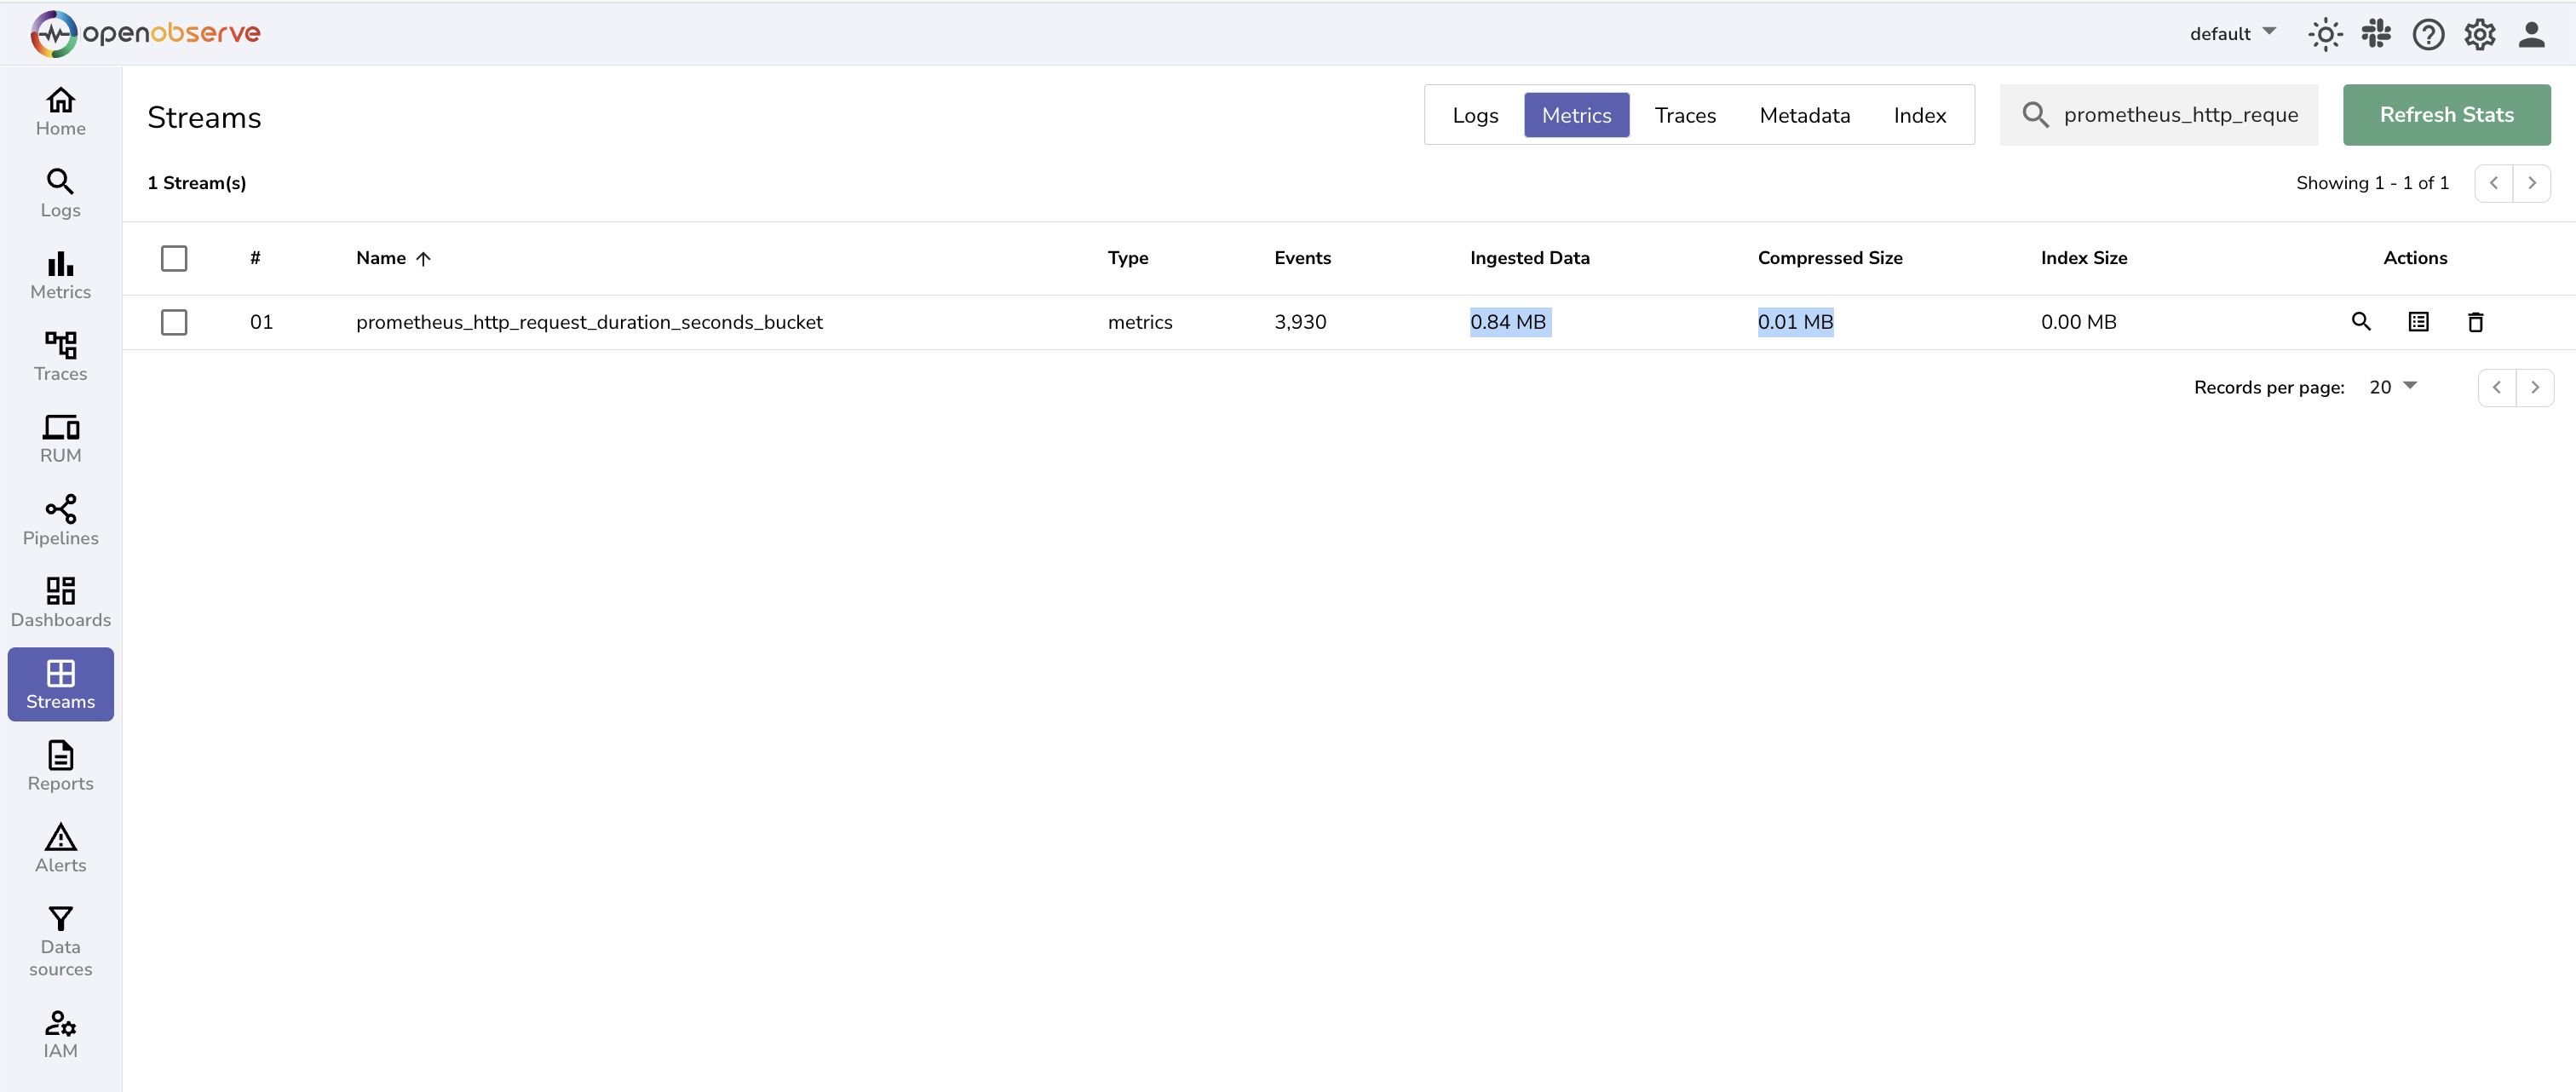
- Optimized Compression: Advanced compression algorithms reduce storage costs.
-
Efficient Indexing: High-performance indexing for fast query execution across large datasets.
-
Downsampling: Automatic data downsampling for long-term storage optimization.
-
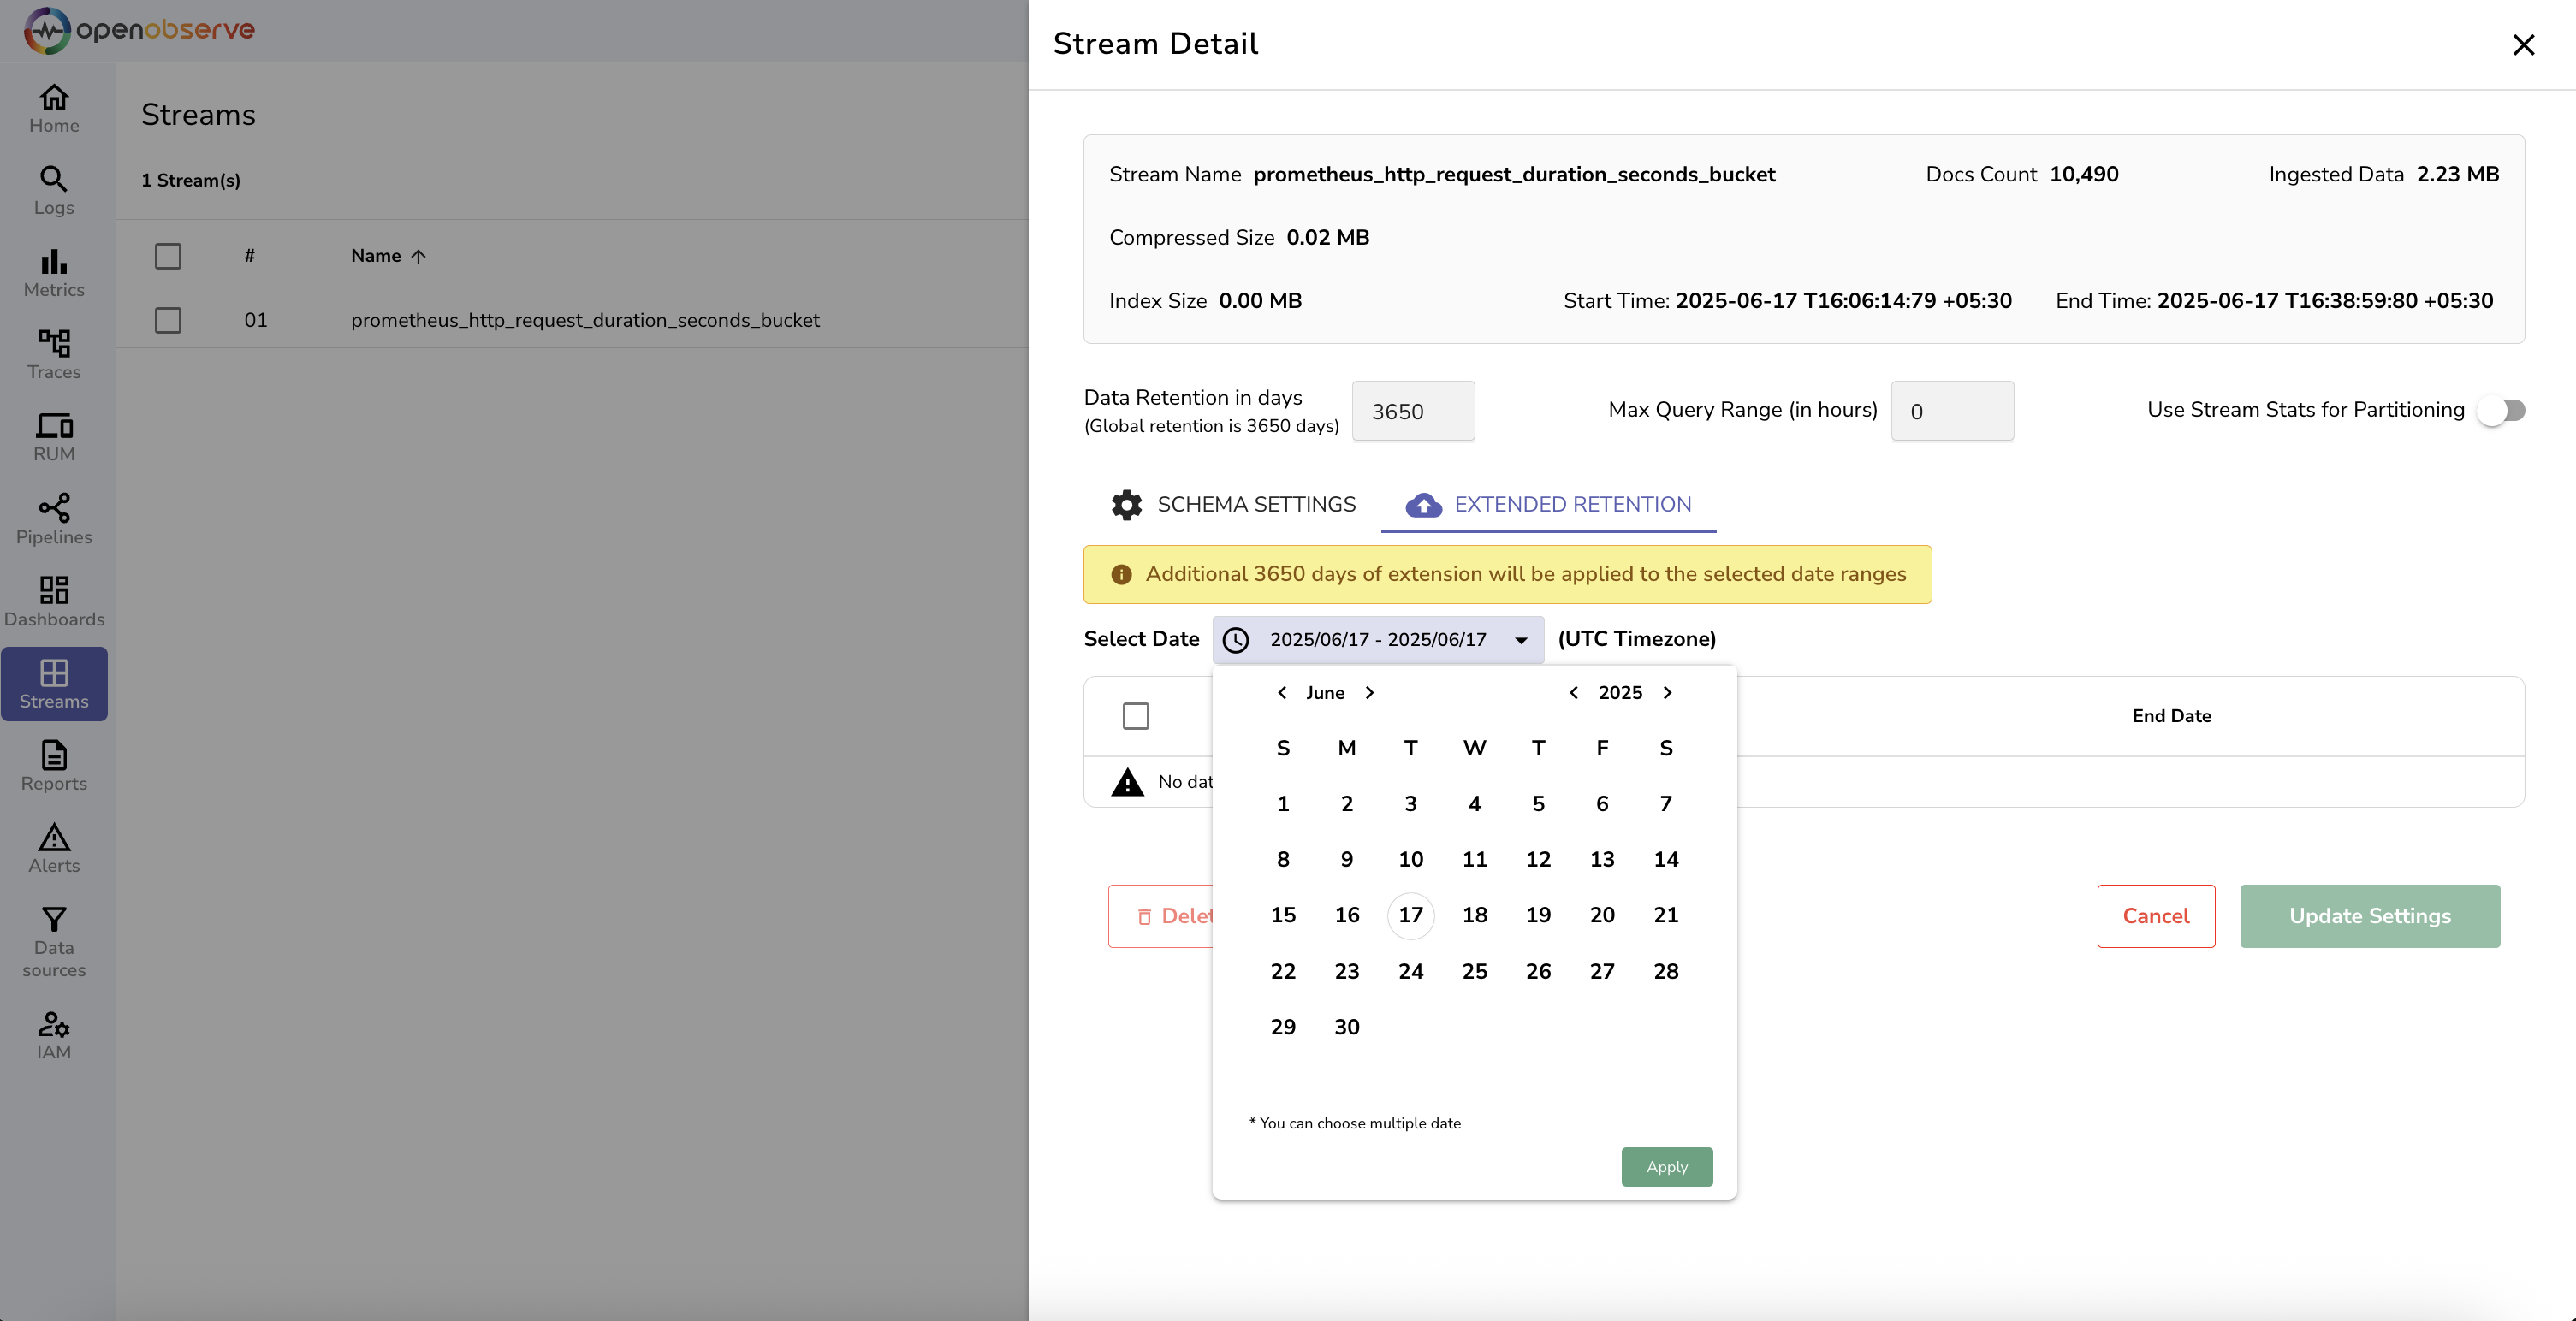
Retention Policies: Configurable retention settings to balance storage costs and data availability.
Integration & Compatibility
- Prometheus Compatible: Full compatibility with Prometheus ecosystem and exporters.
- OpenTelemetry Ecosystem: Full compatibility with OpenTelemetry collectors and instrumentation libraries.
- API Access: RESTful APIs for programmatic access to metrics data.
- Standard Exporters: Support for popular metrics exporters (Node Exporter, cAdvisor, etc.).
Get started with metrics
Ready to send your first metrics to OpenObserve?
- Quickstart: get OpenObserve running in 5 minutes.
- Prometheus remote-write: the most common path for metrics ingestion.
- Telegraf: collect metrics from Telegraf agents.
Next steps
- OpenTelemetry / OTLP: unified ingestion for logs, metrics, and traces.
- Dashboards: visualize metrics alongside logs and traces.
- Alerts: notify on metric thresholds and anomalies.
- Downsampling: keep long-term metrics affordable.
Need some help?
- Join our Community Slack
- Or Contact support