# Best Open Source LLM Observability Tools in 2026: Complete Guide
> A comprehensive comparison of open source LLM observability tools in 2026: OpenObserve, Langfuse, Confident AI, and Arize Phoenix. Covers prompt tracing, cost tracking, online evaluations, and unified infrastructure monitoring.
Source: https://openobserve.ai/blog/llm-observability-tools/
Published: 2026-09-15
Authors: Simran Kumari
Category: Engineering
Tags: AI, Observability, Comparisons, OpenTelemetry, Monitoring, Cost
---
## TL;DR
OpenObserve is the best open source LLM observability tool in 2026 for teams that also need infrastructure monitoring. It provides native LLM tracing, prompt management, and cost tracking alongside unified logs, metrics, and infrastructure telemetry, all in a single self-hosted deployment without requiring separate monitoring stacks.
- **Best unified LLM + infrastructure observability**: OpenObserve: traces AI pipelines and infrastructure telemetry in one platform
- **Best for self-hosted LLM monitoring**: OpenObserve: fully self-hostable, data never leaves your infrastructure, Apache 2.0 licensed
- **Best for OpenTelemetry-native AI tracing**: OpenObserve: accepts OTLP traces from LangChain, LlamaIndex, and any OTel-instrumented AI framework
- **Best for cost tracking across models**: OpenObserve: per-session, per-model token usage tracking with SQL-queryable cost breakdowns
- **Best for online evaluations without a separate eval tool**: OpenObserve: continuous LLM-as-judge scoring at span, trace, or session scope, versioned and alertable
- **Best for AI + DevOps teams sharing a platform**: OpenObserve: one tool for ML engineers monitoring prompts and SREs monitoring infrastructure
- **Best for replacing fragmented AI monitoring**: OpenObserve: eliminates separate LLM observability tools and infrastructure monitoring with unified telemetry
[Try OpenObserve free →](https://cloud.openobserve.ai/web/login?mode=signup)
---
## **What Is LLM Observability?**
LLM observability is the practice of monitoring, tracing, and analyzing every layer of an AI application from the prompt you send to the final response your model returns. As AI systems grow more complex, with multi-step agent workflows, retrieval-augmented generation (RAG) pipelines, and tool calls chained together, traditional logging falls short.
The four core components of LLM observability are:
* **Tracing** tracking the full lifecycle of a user interaction, including intermediate steps, model API calls, and tool invocations
* **Evaluation** measuring output quality through automated metrics (relevance, faithfulness, toxicity) or human annotation. See [LLM Evals vs Observability](https://openobserve.ai/blog/llm-evals-vs-observability/) for how these two layers work together.
* **Cost & Usage Monitoring** tracking token consumption, latency, and spend per model, user, or session
* **Prompt Management** versioning, testing, and iterating on prompts without losing reproducibility
Without these, teams are blind to quality regressions, prompt drift, hallucinations, and runaway API costs in production.
## **Why Is LLM Observability Different From Traditional Monitoring?**
Traditional observability tools like Grafana and Prometheus are excellent for infrastructure-level signals CPU, memory, request rates, latency percentiles. But LLMs introduce an entirely new class of failure that metrics alone cannot detect:
| Traditional Monitoring | LLM Observability |
| ----- | ----- |
| Tracks uptime, latency, error rates | Tracks hallucinations, prompt quality, output relevance |
| Alerts on crashes or timeouts | Alerts on silent quality regressions |
| Measures infrastructure health | Measures model behavior and output correctness |
| Query languages: PromQL, SQL | Evaluation frameworks: LLM-as-judge, semantic similarity |
| Dashboards for SREs | Dashboards for ML engineers and product teams |
This is not to say the two are mutually exclusive. [OpenObserve](https://openobserve.ai/) is the standout open source platform that bridges both worlds delivering unified infrastructure telemetry (logs, metrics, traces) while natively supporting LLM-specific monitoring, all in a single deployment. For teams that want one tool to cover the entire observability stack, it is the strongest option available today.
## **What Should You Look for in an Open Source LLM Observability Tool?**
A CHI 2025 study with 30 developers identified four core design principles every solid LLM observability tool should satisfy:
| Principle | What It Means |
| ----- | ----- |
| **Awareness** | Makes model behavior visible you understand what is happening inside the system |
| **Monitoring** | Real-time feedback during training and evaluation to catch issues early |
| **Intervention** | Enables you to act on problems as they surface, not after users report them |
| **Operability** | Supports long-term maintainability as models and requirements evolve |
Beyond those principles, evaluate tools on:
* **Self-hosting support** critical for data residency and compliance
* **Framework integrations** LangChain, LlamaIndex, OpenAI SDK, LiteLLM, Vercel AI SDK, Haystack
* **OpenTelemetry compatibility** avoids vendor lock-in and lets you route traces to any OTEL-compatible backend
* **Evaluation capabilities** LLM-as-judge, human annotation, hallucination detection
* **Prompt management** versioning and collaboration features for iterating on prompts
* **Cost tracking** per-user, per-model, per-session breakdowns
* **Unified observability** whether the tool also covers infrastructure so you don't need a second platform
* **License** MIT, Apache 2.0, and Elastic License 2.0 carry very different implications for commercial use
## **Top Open Source LLM Observability Tools**
### **1\. OpenObserve**
**License:** AGPL-3.0 (open source) | **Website:** [openobserve.ai](https://openobserve.ai/) | **Cloud:** [cloud.openobserve.ai](https://cloud.openobserve.ai/web/login?mode=signup)
**OpenObserve is our top pick for 2026\.** While most tools on this list specialize in LLM-specific concerns, OpenObserve unifies LLM observability with full infrastructure monitoring logs, metrics, traces, and frontend (RUM) monitoring in a single deployment. For teams tired of managing a separate DevOps telemetry stack alongside a dedicated LLM tool, OpenObserve eliminates that overhead entirely.
Built on OpenTelemetry standards and using a Parquet/Vertex columnar format with aggressive compression, OpenObserve delivers approximately **140x lower storage costs in typical log workloads** compared to Elasticsearch-based stacks (actual results vary based on data entropy and cardinality). Its SQL-based query interface means teams can correlate LLM trace data with infrastructure metrics without learning multiple proprietary query languages. And with single binary deployment, you can be up and running in under 2 minutes.
Read the [detailed list of LLM observability features](https://openobserve.ai/llm-observability/) on the OpenObserve site, or go straight to the [LLM applications setup docs](https://openobserve.ai/docs/integration/ai/llm-applications/) to start tracing.
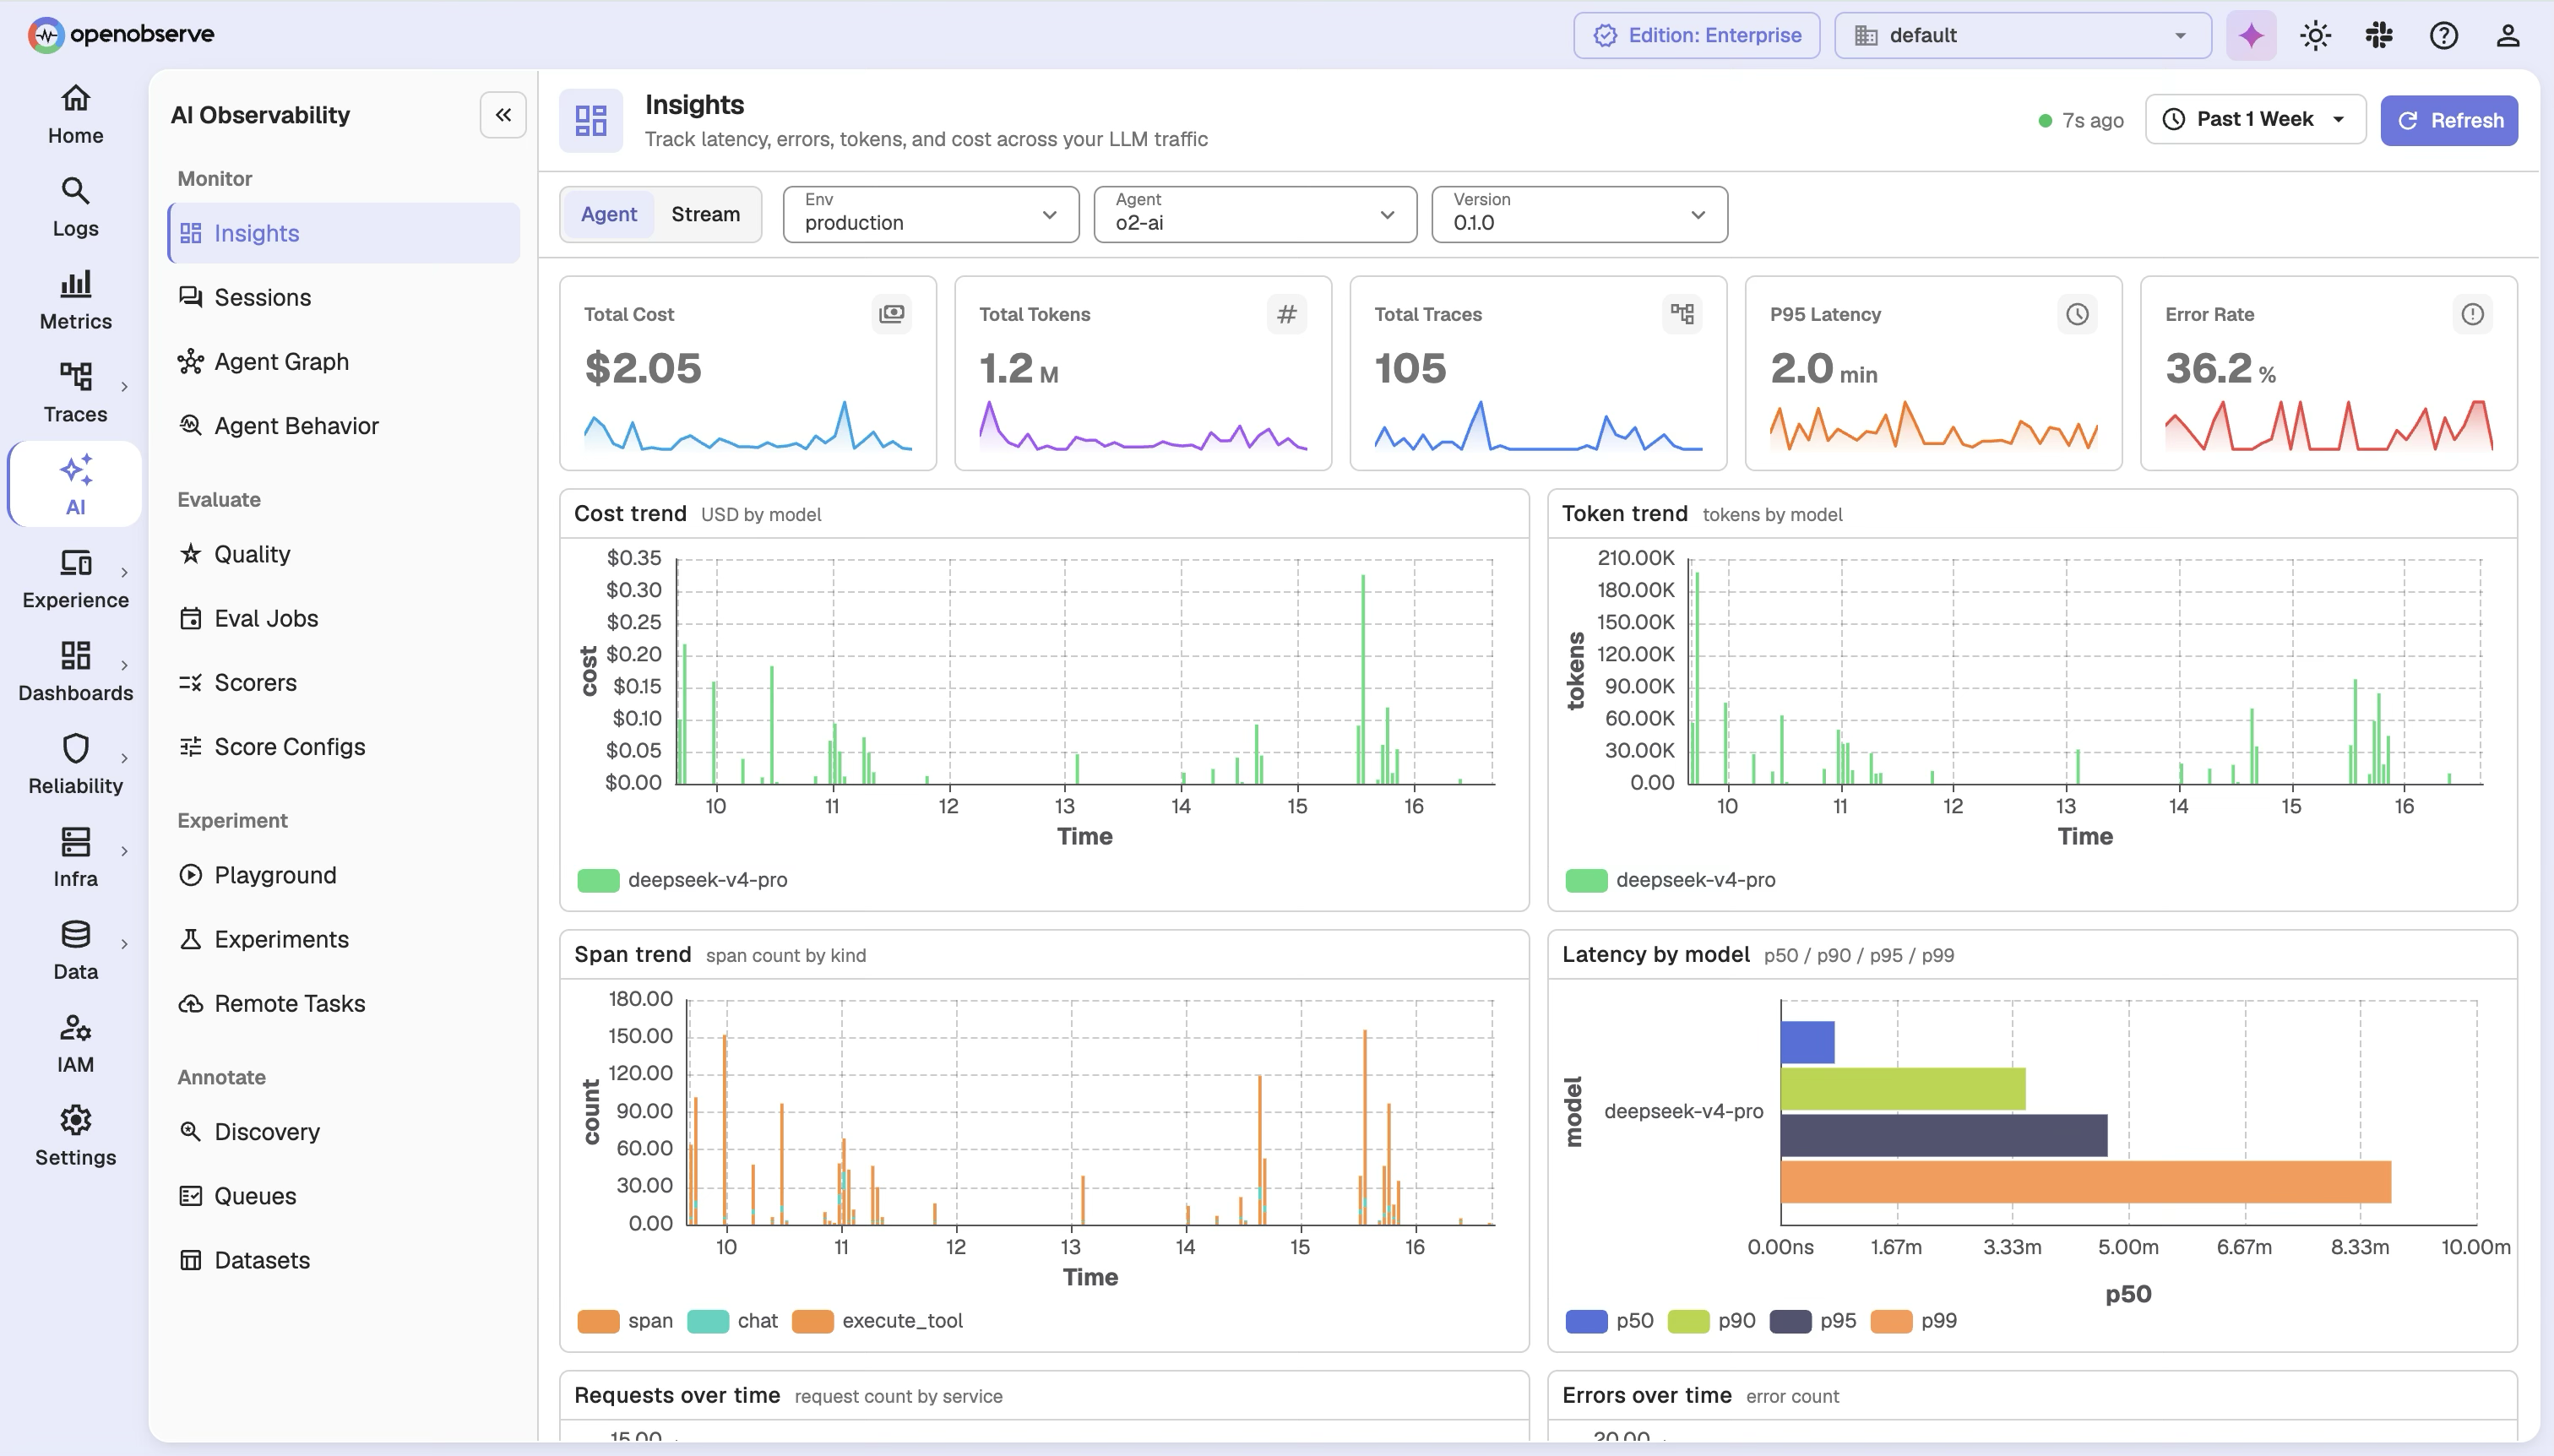
**Key Features:**
* **Unified platform** logs, metrics, traces, LLM traces, and RUM monitoring in one tool no multi-component stack
* **OpenTelemetry-native** drop-in instrumentation for LLM applications using any OTEL SDK
* **[Online Evaluations](https://openobserve.ai/docs/integration/ai/llm-evaluations/) (enterprise)** continuous LLM-as-judge scoring of production traces at span, trace, or session scope, using your own provider keys or a remote scoring endpoint you already run
* **[LLM Experiments](https://openobserve.ai/docs/integration/ai/llm-experiments/)** offline, batch evaluation against a fixed dataset, so you can compare runs and confirm a prompt or model change actually improved quality before it ships
* **Versioned scorers and score configs** judge prompts are editable, not a black box, and pin to a version so tightening a rubric never rewrites last quarter's numbers
* **[MCP server](https://openobserve.ai/docs/integration/ai/mcp/)** connect it in Claude Code, Cursor, or another MCP client to auto-instrument an application in one prompt, or query trace data in natural language
* **Agent execution graphs** multi-agent and multi-step runs reassemble into a single trace across service boundaries via W3C context propagation, grouped into conversations by session ID
* **SQL-based queries** correlate LLM trace data with infrastructure signals using familiar syntax, no PromQL or LogQL needed
* **Lower storage costs**: Parquet columnar format with aggressive compression reduces spend dramatically at scale (approximately 140x lower than Elasticsearch-based stacks in typical log workloads; actual results vary)
* **High-cardinality support** handles per-user, per-session, and per-request LLM telemetry without performance degradation
* **Single binary deployment** self-hosted in under 2 minutes; no Kubernetes expertise required
* **[Alerts, SLOs, and AI SRE](https://openobserve.ai/platform/alerts/)** alert on token cost spikes, latency, error rate, or eval-score drops, and route AI regressions into a tracked [incident](https://openobserve.ai/platform/incidents/) on the same on-call workflow as infrastructure outages, instead of a dashboard nobody's watching
* **[Pipelines](https://openobserve.ai/platform/pipelines/) for prompt redaction** mask or drop sensitive fields (PII, customer data, proprietary prompts) in-flight, before anything touches disk, so compliance requirements are enforced at ingest rather than bolted on after the fact
* **Broad AI integration catalog** [agent frameworks](https://openobserve.ai/docs/integration/ai/frameworks/) (LangChain, CrewAI, LlamaIndex, AutoGen), [model providers](https://openobserve.ai/docs/integration/ai/providers/) (OpenAI, Anthropic, Gemini, Mistral, Ollama), [AI gateways](https://openobserve.ai/docs/integration/ai/gateways/) (Portkey, LiteLLM Proxy, OpenRouter, Kong AI), and [no-code builders](https://openobserve.ai/docs/integration/ai/no-code/) (n8n, Flowise, LangFlow, OpenWebUI)
* **Self-hosted or Cloud** full data residency control with flexible deployment options
**Pros:**
* Only open source platform that covers infrastructure observability AND LLM tracing in a single tool eliminates tool sprawl entirely
* Online Evaluations bring LLM-as-judge scoring into the same store as the trace, so quality, cost, and latency sit next to each other instead of in a second product
* Efficient columnar storage compression makes it dramatically cheaper to retain long-term LLM trace history (approximately 140x lower than Elasticsearch-based stacks in typical log workloads; actual results vary)
* SQL querying lowers the learning curve one language for both infrastructure and LLM queries
* MCP server lets a coding agent wire up instrumentation or answer trace questions in natural language, without writing SQL by hand
* Single binary deployment means near-zero operational overhead
* Fully OpenTelemetry-native no vendor lock-in, switch or extend components freely
* Alerts, SLOs, and incident response live in the same platform as the LLM traces, so a cost or quality regression follows one response path instead of a dashboard-and-pager-tool handoff
* Redaction pipelines plus self-hosting give a straightforward answer to "does this prompt data ever leave our infrastructure": no
* Predictable flat-rate pricing on Cloud no per-host or per-metric billing surprises
**Cons:**
* LLM-specific community is smaller, though the broader observability community is strong and growing
**Pricing:**
* Open source (self-hosted): Free
* Cloud: No monthly minimum; usage-based pricing with no per-host charges
**Best for:** Teams that want a single open source platform covering both LLM observability and infrastructure monitoring, organizations with high data volumes where storage cost is a real concern, and teams with strict self-hosting or data residency requirements.
### **2\. Langfuse**
**GitHub Stars:** 21,000+ (as of February 2026\) | **License:** MIT (core) | **Website:** langfuse.com
Langfuse is the most widely adopted open source LLM-specific observability platform. Originally from YCombinator W23, it was recently acquired by [ClickHouse](/clickhouse-alternative/), signalling a strong long-term investment in its data infrastructure. Its MIT-licensed core covers end-to-end tracing, prompt management, evaluation, and datasets everything a production LLM team needs on the application layer.
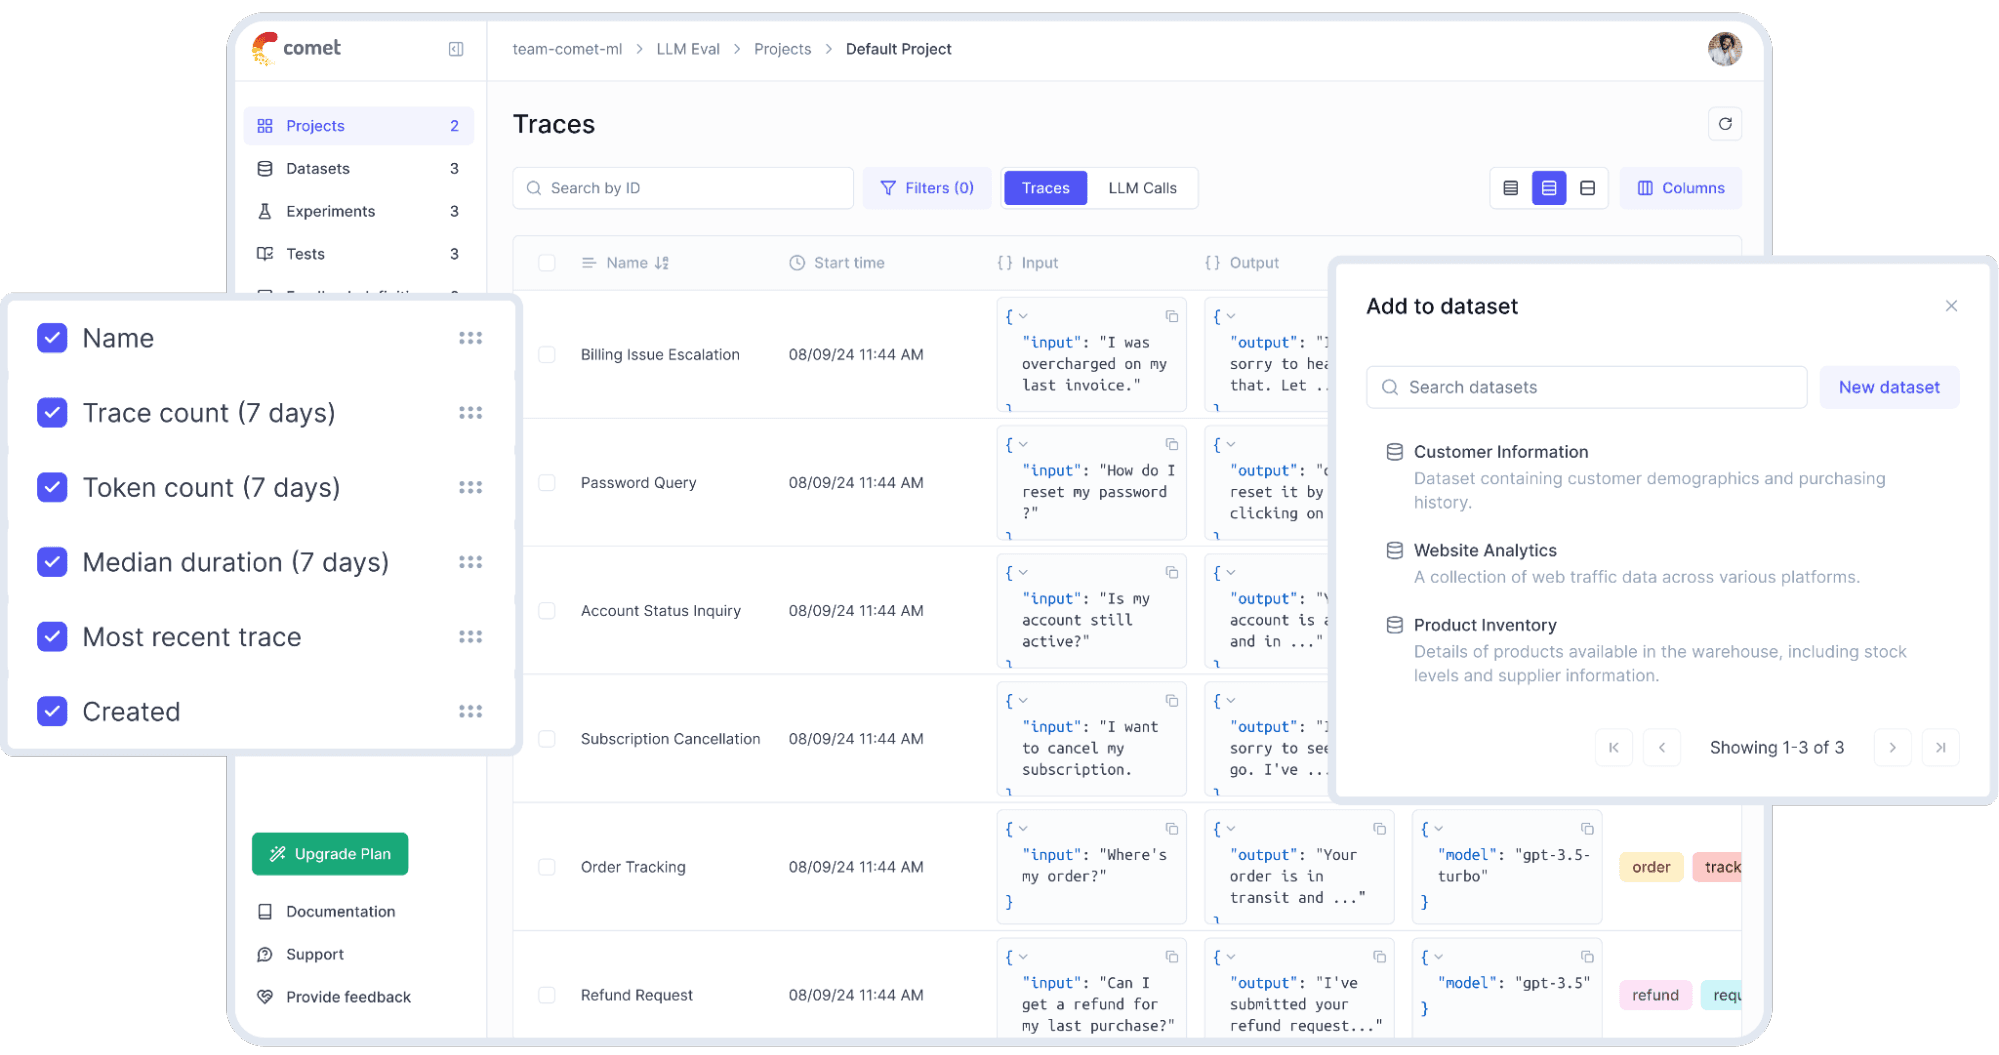
**Key Features:**
* End-to-end tracing across LLM calls, retrieval steps, and agent actions with waterfall views
* Session replay to reconstruct complete conversation histories for debugging
* Prompt management with version control and live iteration without redeployment
* LLM-as-a-judge evaluation workflows for hallucination, toxicity, and relevance
* LLM Playground for testing prompts directly from a failed trace
* Native integrations: LangChain, LlamaIndex, OpenAI SDK, LiteLLM, Vercel AI SDK, Haystack, Mastra
* Self-host via Docker Compose in under 5 minutes
**Pros:**
* Strongest LLM-specific community adoption in the open source space
* Covers the full LLM development lifecycle tracing, evals, datasets, prompt management
* Generous free tier on Langfuse Cloud (50k events/month, 2 users)
* True MIT license on core features
* Pairs naturally with [OpenObserve](https://openobserve.ai/) as the infrastructure observability layer
**Cons:**
* No built-in infrastructure monitoring needs a separate platform like [OpenObserve](https://cloud.openobserve.ai/web/login?mode=signup) for full-stack visibility
* Enterprise features (SSO, RBAC, advanced security) are separately licensed
* Cloud pricing can grow quickly at high event volumes
**Pricing:**
* Self-hosted: Free
* Cloud: Free up to 50k events/month, then $29/month for 100k events ($8/100k additional)
**Best for:** Engineering teams that want the deepest open source LLM-specific observability with prompt management and evaluation built in.
### **3\. Arize Phoenix**
**License:** Elastic License 2.0 (source-available) | **Website:** phoenix.arize.com
Arize Phoenix is a source-available observability platform built specifically for LLM applications, RAG pipelines, and agent workflows. Built on OpenTelemetry standards, it includes built-in hallucination detection and embedding drift visualisation, making it particularly powerful for teams iterating on retrieval pipelines.
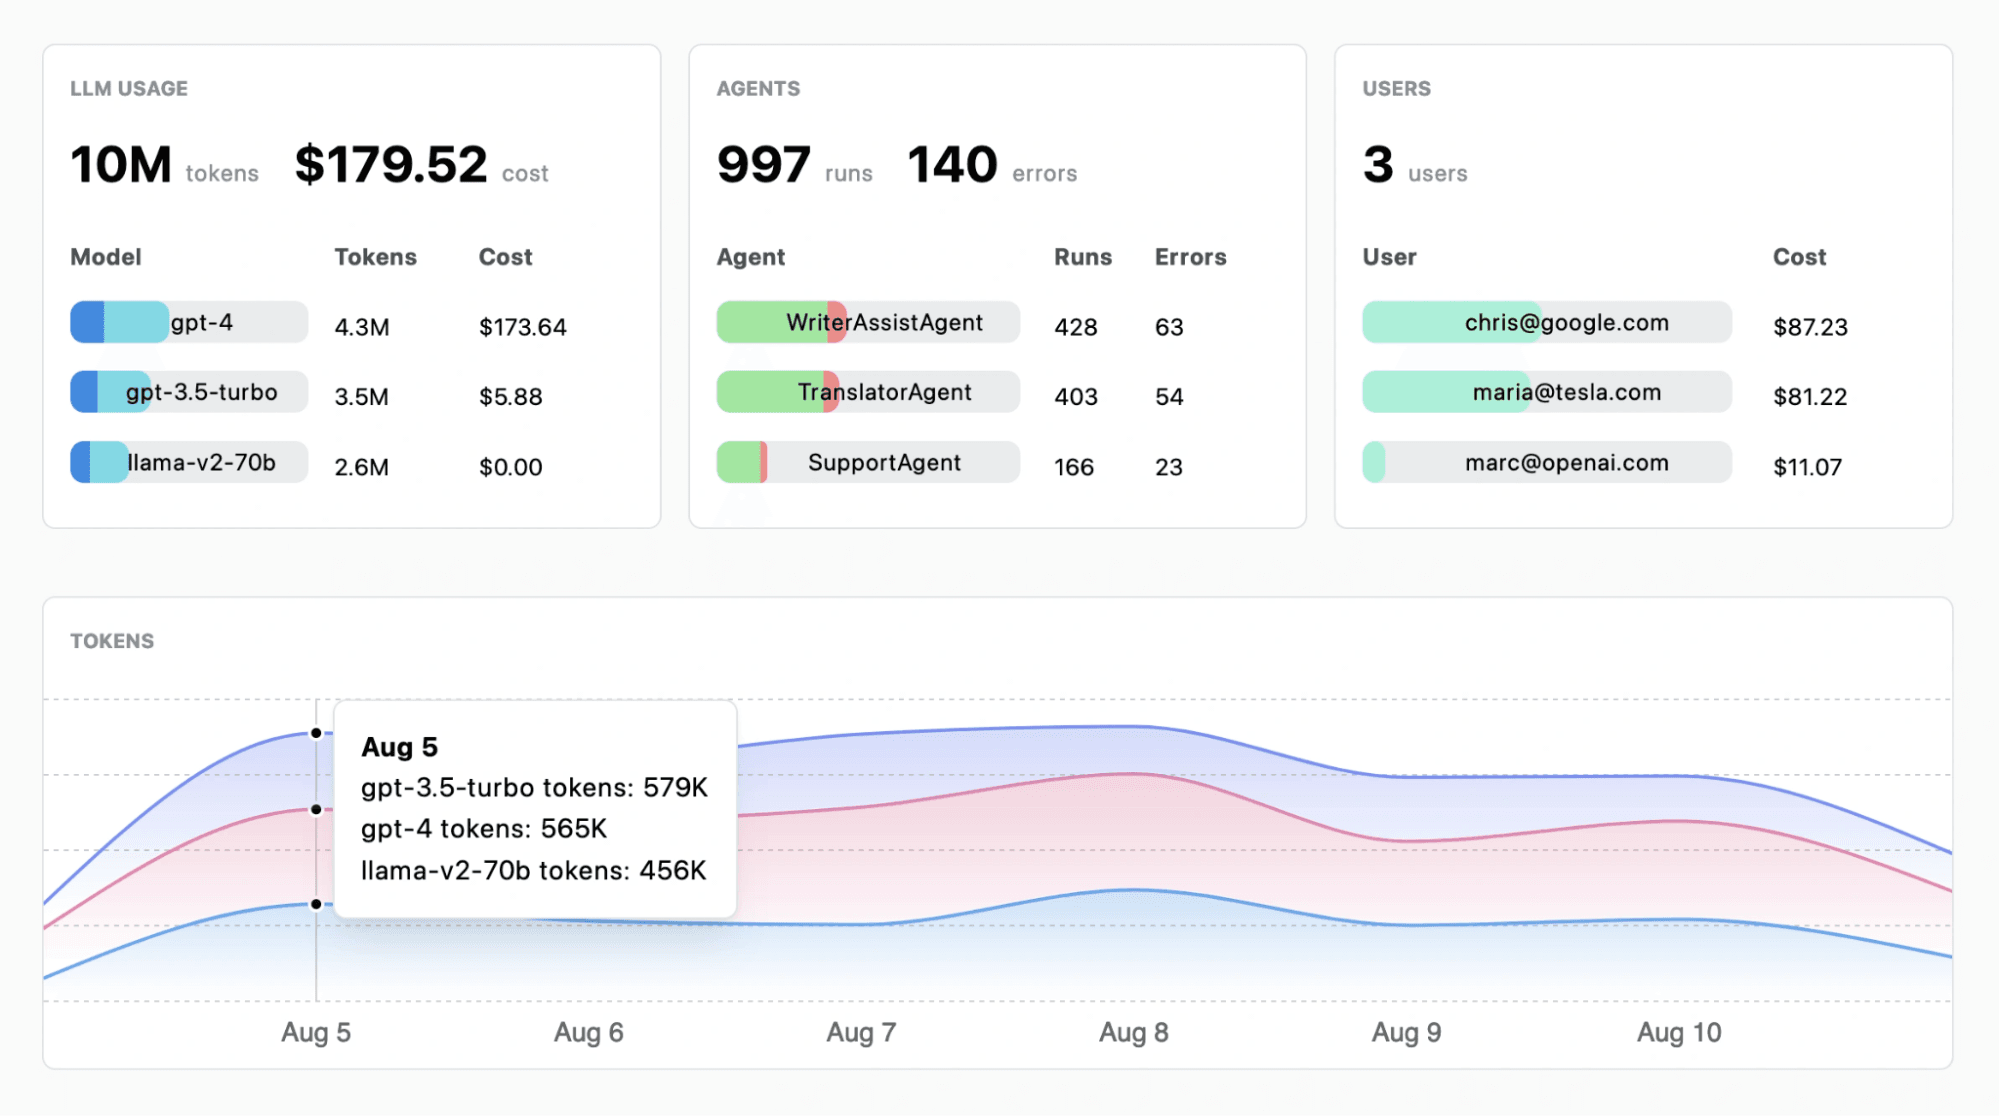
**Key Features:**
* End-to-end tracing for prompts, responses, and agent workflows
* RAG observability inspect retrieval results, chunk quality, and grounding
* Hallucination detection built in
* Embedding drift detection for monitoring distribution shifts over time
* OpenTelemetry-native export to [OpenObserve](https://openobserve.ai/), [Datadog](/datadog-alternative/), [Grafana](/grafana-alternative/), or any OTEL backend
* Supports Python and JavaScript
**Pros:**
* Purpose-built for RAG and agent debugging best-in-class for retrieval pipeline visibility
* OTEL-native design eliminates vendor lock-in
* Free for the open source Phoenix version
* Rich visualizations for understanding embedding spaces and cluster drift
**Cons:**
* Elastic License 2.0 restricts certain commercial uses (not true open source)
* Less mature prompt management than Langfuse
* No infrastructure monitoring requires a separate backend like [OpenObserve](https://cloud.openobserve.ai/web/login?mode=signup)
* Enterprise features require moving to Arize AI platform ($50/month+)
**Pricing:**
* Phoenix (open source): Free
* Arize AX Pro: $50/month; Enterprise: custom
**Best for:** AI engineering teams building RAG-based systems and agent workflows where deep retrieval pipeline visibility is critical.
### **4\. Comet Opik**
**License:** Apache 2.0 | **Website:** comet.com/site/products/opik
Opik is an open source LLM observability and evaluation platform from Comet ML, focused on systematic testing, optimization, and production monitoring. It stands out for its automated prompt optimization six algorithms including Few-shot Bayesian, evolutionary, and LLM-powered MetaPrompt approaches which is rare in open source tooling.
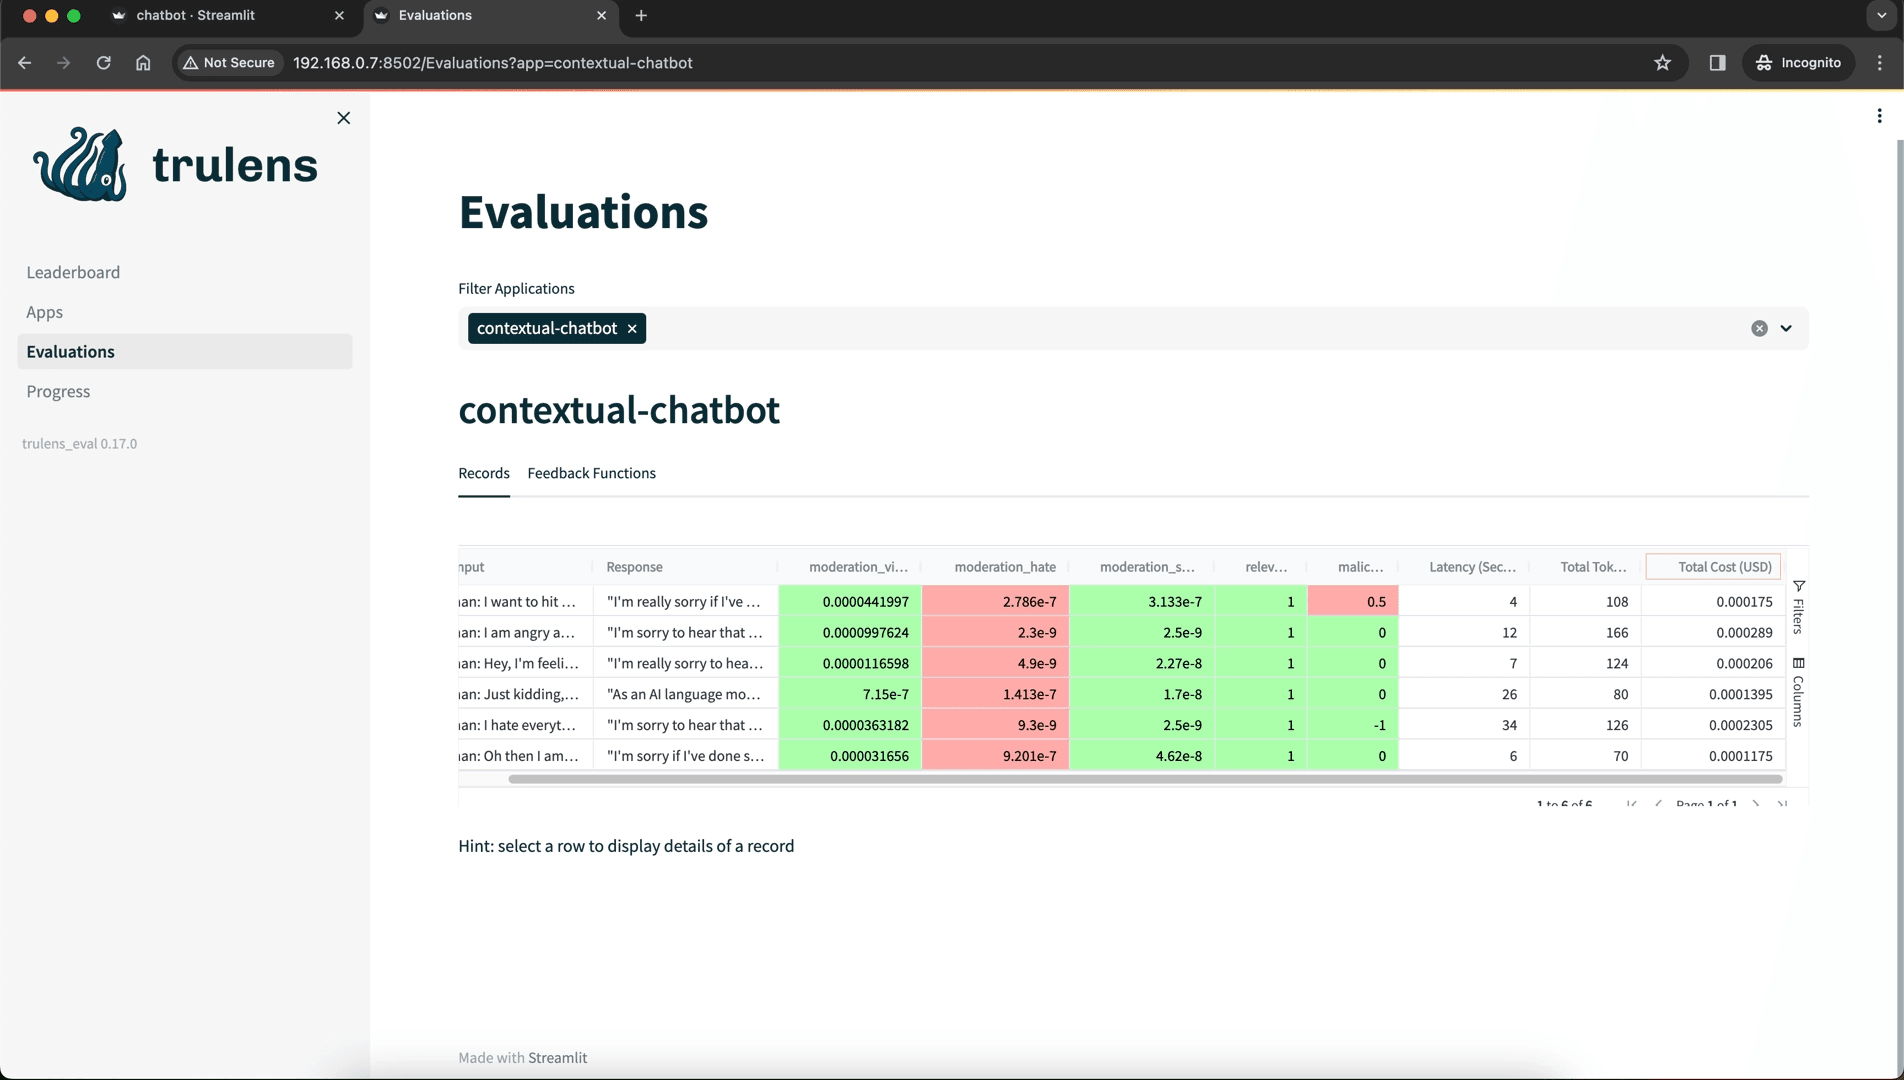
**Key Features:**
* Full tracing for LLM calls, agent steps, and RAG pipelines
* Automated prompt optimization (six algorithms built in)
* Built-in guardrails for PII filtering, off-topic detection, and competitor mention blocking
* Works with any LLM provider; native integrations for LangChain, LlamaIndex, OpenAI, Anthropic, Vertex AI
* 60-day data retention on free hosted plan with unlimited team members
* Self-hostable with full features available in the codebase
**Pros:**
* Automated prompt optimization is a major differentiator saves significant engineering time
* Guardrails are built in, not bolted on
* Truly open source (Apache 2.0) with full feature access
* Unlimited team members on free tier
**Cons:**
* Smaller community than Langfuse
* No infrastructure monitoring best paired with [OpenObserve](https://cloud.openobserve.ai/web/login?mode=signup) for full-stack visibility
* Some advanced analytics features are cloud-only
**Pricing:**
* Free hosted: 25k spans/month, unlimited team members, 60-day retention
* Pro: $39/month for 100k spans ($5 per additional 100k)
**Best for:** Teams that want comprehensive observability with automated prompt optimization and guardrails built in.
### **5\. Confident AI**
**License:** Commercial platform, self-hosting available on the Enterprise plan | **Website:** confident-ai.com
Confident AI is an eval-first, OpenTelemetry-native LLM observability platform for teams running AI in production. It traces agent workflows while monitoring quality, cost, and latency together, then closes the loop: failures found in production become annotation queues, datasets, and CI/CD quality gates that stop the same regression from shipping twice.
**Key Features:**
* OTel-native tracing: captures every agent run, model call, tool call, and context retrieval across 20+ frameworks, gateways, and model providers, with cost and latency attributed by model, feature, and trace
* Annotation workflows: routes traces into review queues with custom forms and criteria, where expert feedback aligns automated evaluations with human judgment
* Online and offline evaluations: scores live production traces with monitored alerting, and surfaces recurring failures, sentiment, emerging use cases, and drift
* Production-to-dataset loop: builds evaluation datasets from production traces on configurable triggers, feeding CI/CD quality gates that test releases against failures already seen in production
* Exports traces to S3 or Azure, or forwards them to an existing OpenTelemetry collector, so it can run alongside an infrastructure platform
* Triage via saved views, tags, and one-click tickets into Linear, GitHub, or Jira
**Pros:**
* Combines tracing and evaluation in one workflow, so quality, cost, and latency don't live in separate tools
* Annotation queues turn expert review into an ongoing feedback loop instead of a one-off audit
* Production failures automatically become CI/CD test cases, catching repeat regressions before release
* OpenTelemetry-native, so it can sit alongside an infrastructure platform like OpenObserve for host, application, database, and network telemetry
**Cons:**
* Scoped to LLM and agent quality rather than infrastructure logs, host metrics, and conventional application monitoring
* Commercial platform, not open source
* Teams that only need request logging and token counts may not need the full evaluation, annotation, and dataset workflow
**Pricing:**
* Starts at $200/month with unlimited seats; Enterprise (including self-hosting) is custom
**Best for:** Teams that want evaluation, annotation, and a production-to-CI feedback loop built into one platform, paired with an infrastructure tool like OpenObserve for host, application, and network telemetry.
### **6\. Lunary**
**License:** Apache 2.0 | **Website:** lunary.ai
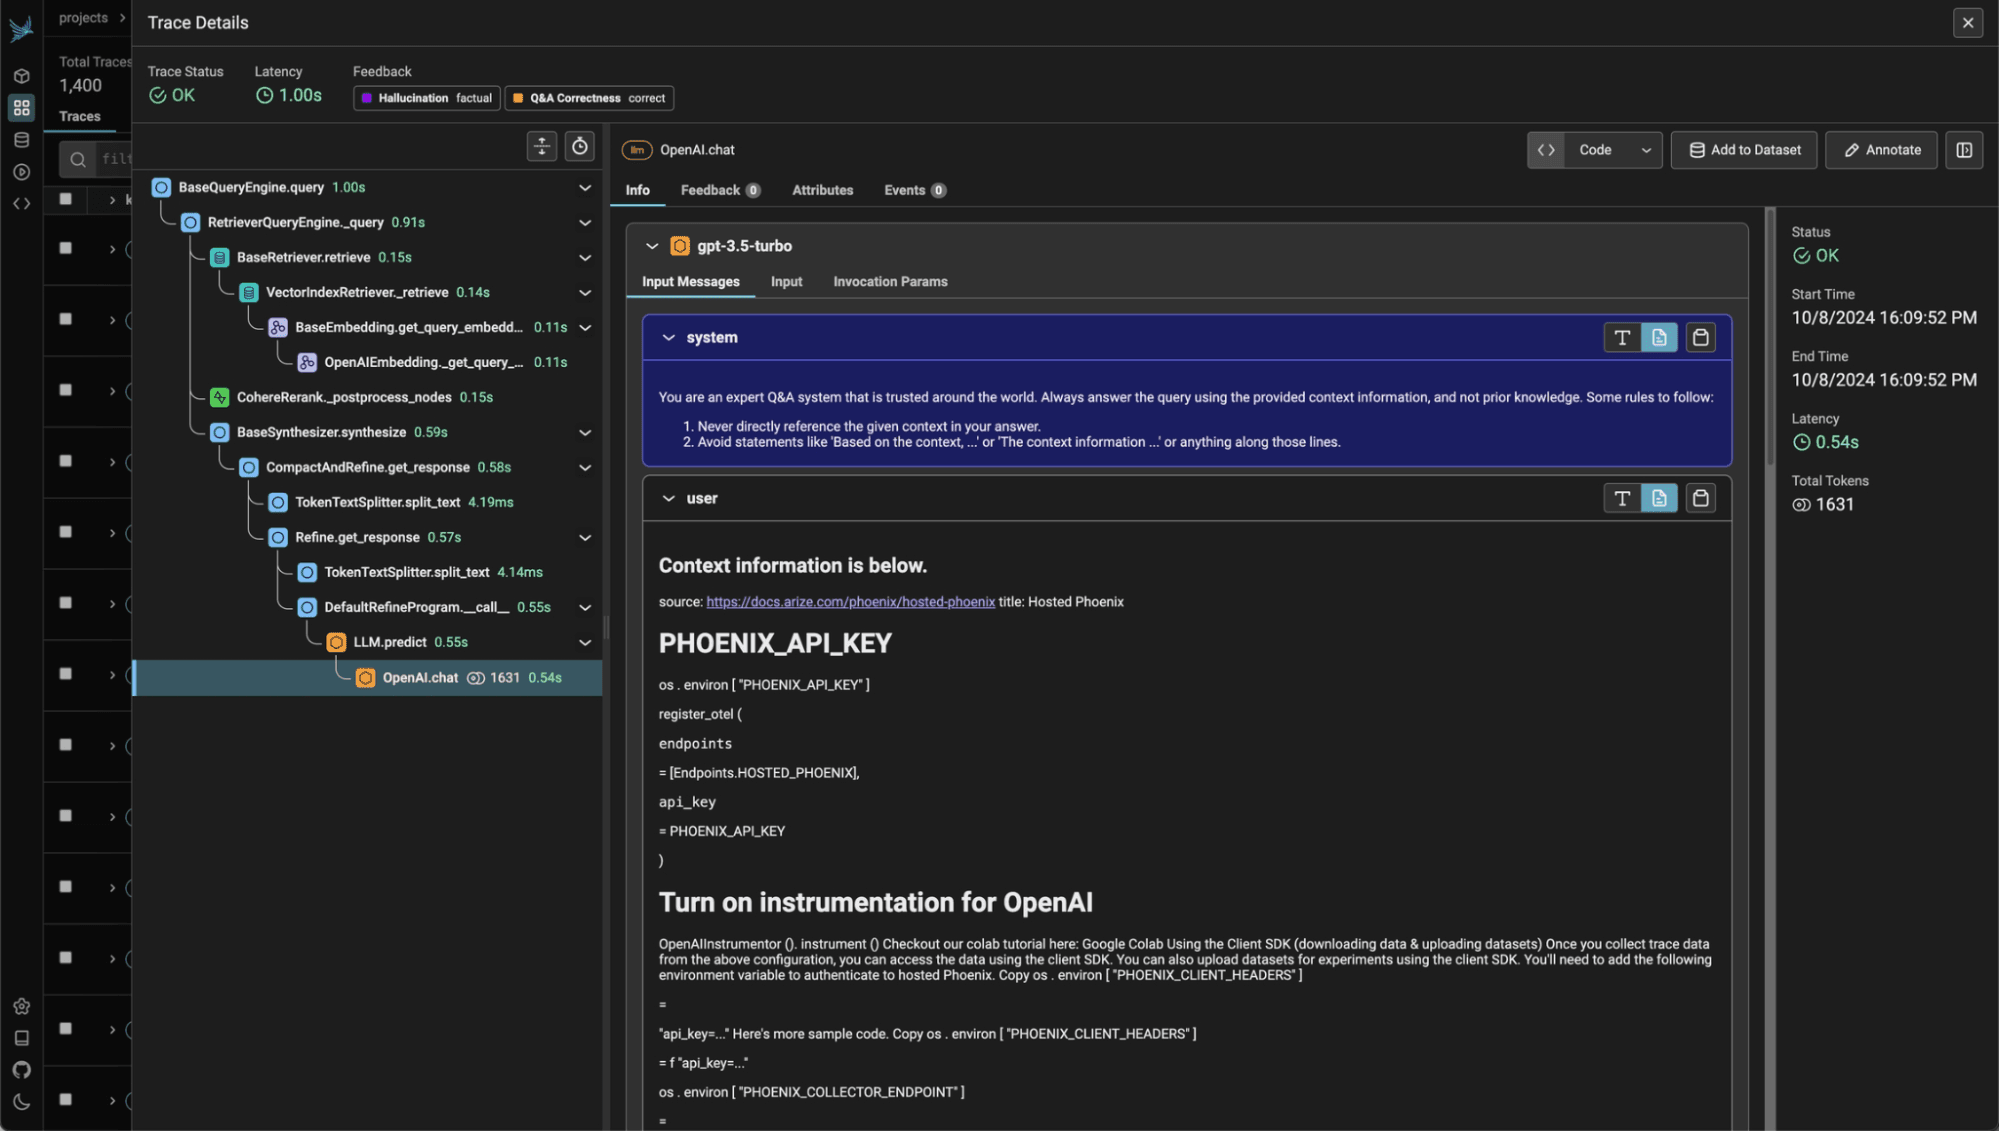
Lunary is a lightweight open source observability platform optimized for RAG pipelines and chatbot applications. It offers SDKs for JavaScript (Node.js, Deno, Vercel Edge, Cloudflare Workers) and Python, with a setup time of roughly two minutes. Its Radar feature automatically categorizes LLM responses based on pre-defined criteria, making it easy to audit outputs at scale.
**Key Features:**
* Specialized RAG tracing with embedding metrics and latency visualization
* Radar: rule-based categorization of LLM responses for downstream auditing
* SDKs for JavaScript environments including Vercel Edge and Cloudflare Workers
* Session-level tracing for chatbot conversations
* 10k events/month free with 30-day retention
**Pros:**
* Best JavaScript/TypeScript support of any tool on this list
* Lightweight and fast to set up under 2 minutes
* Purpose-built for RAG and chatbot use cases
**Cons:**
* Narrower feature set than Langfuse or [OpenObserve](https://openobserve.ai/)
* Some advanced features require Enterprise licensing
* Smaller community and ecosystem
**Pricing:**
* Free tier: 10k events/month, 30-day retention
* Enterprise: Custom (includes self-hosting)
**Best for:** JavaScript-first teams building RAG pipelines or chatbot applications who need quick observability setup.
### **7\. TruLens**
**License:** MIT | **Website:** trulens.org
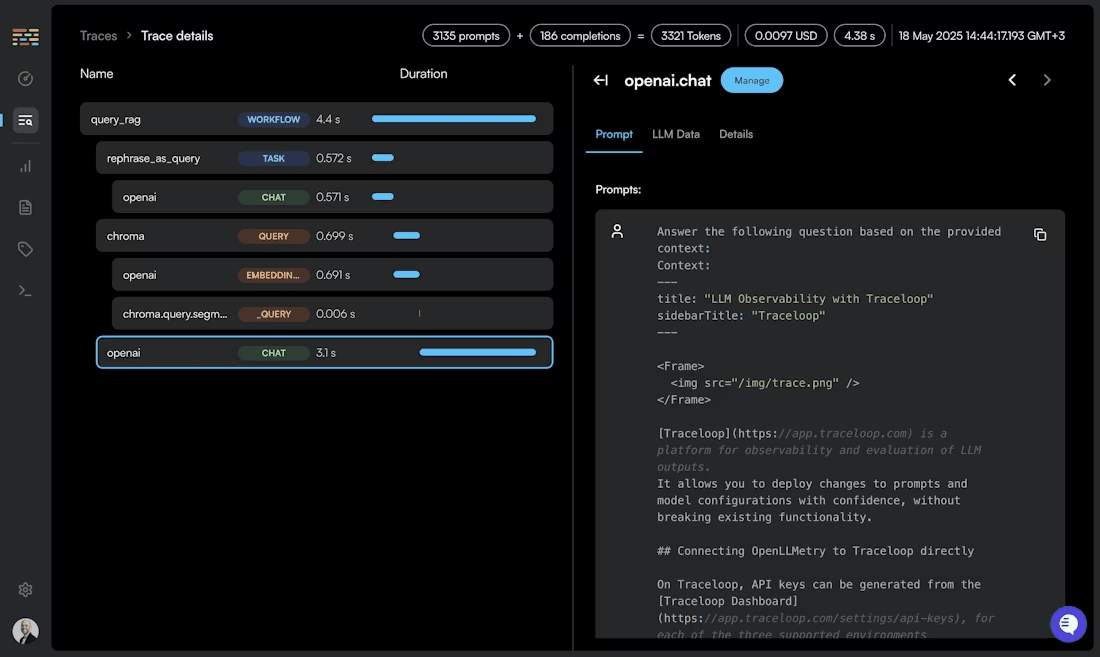
TruLens takes a qualitative-first approach to LLM observability, built around structured feedback functions that evaluate LLM responses after each call. It is particularly strong for teams using LlamaIndex and LangChain who want systematic evaluation pipelines rather than traditional tracing.
**Key Features:**
* Feedback functions that run automatically after each LLM call
* Pre-built evaluators for relevance, groundedness, and coherence
* RAG triad evaluation: answer relevance, context relevance, groundedness
* Deep integration with LlamaIndex and LangChain
* LLM-agnostic supports any model as an evaluator
**Pros:**
* Best-in-class for structured, systematic evaluation pipelines
* RAG triad evaluation is a well-regarded methodology for RAG quality assessment
* MIT licensed with no restrictions
**Cons:**
* Python only no JavaScript/TypeScript support
* Less focus on tracing and production monitoring than Langfuse or [OpenObserve](https://openobserve.ai/)
* Smaller community than Langfuse
**Pricing:** Free (MIT licensed)
**Best for:** Research teams and ML engineers who need rigorous, automated evaluation pipelines for RAG systems with Python-native tooling.
### **8\. PostHog LLM Analytics**
**GitHub Stars:** 32,100+ (as of March 2026\) | **License:** MIT | **Website:** posthog.com
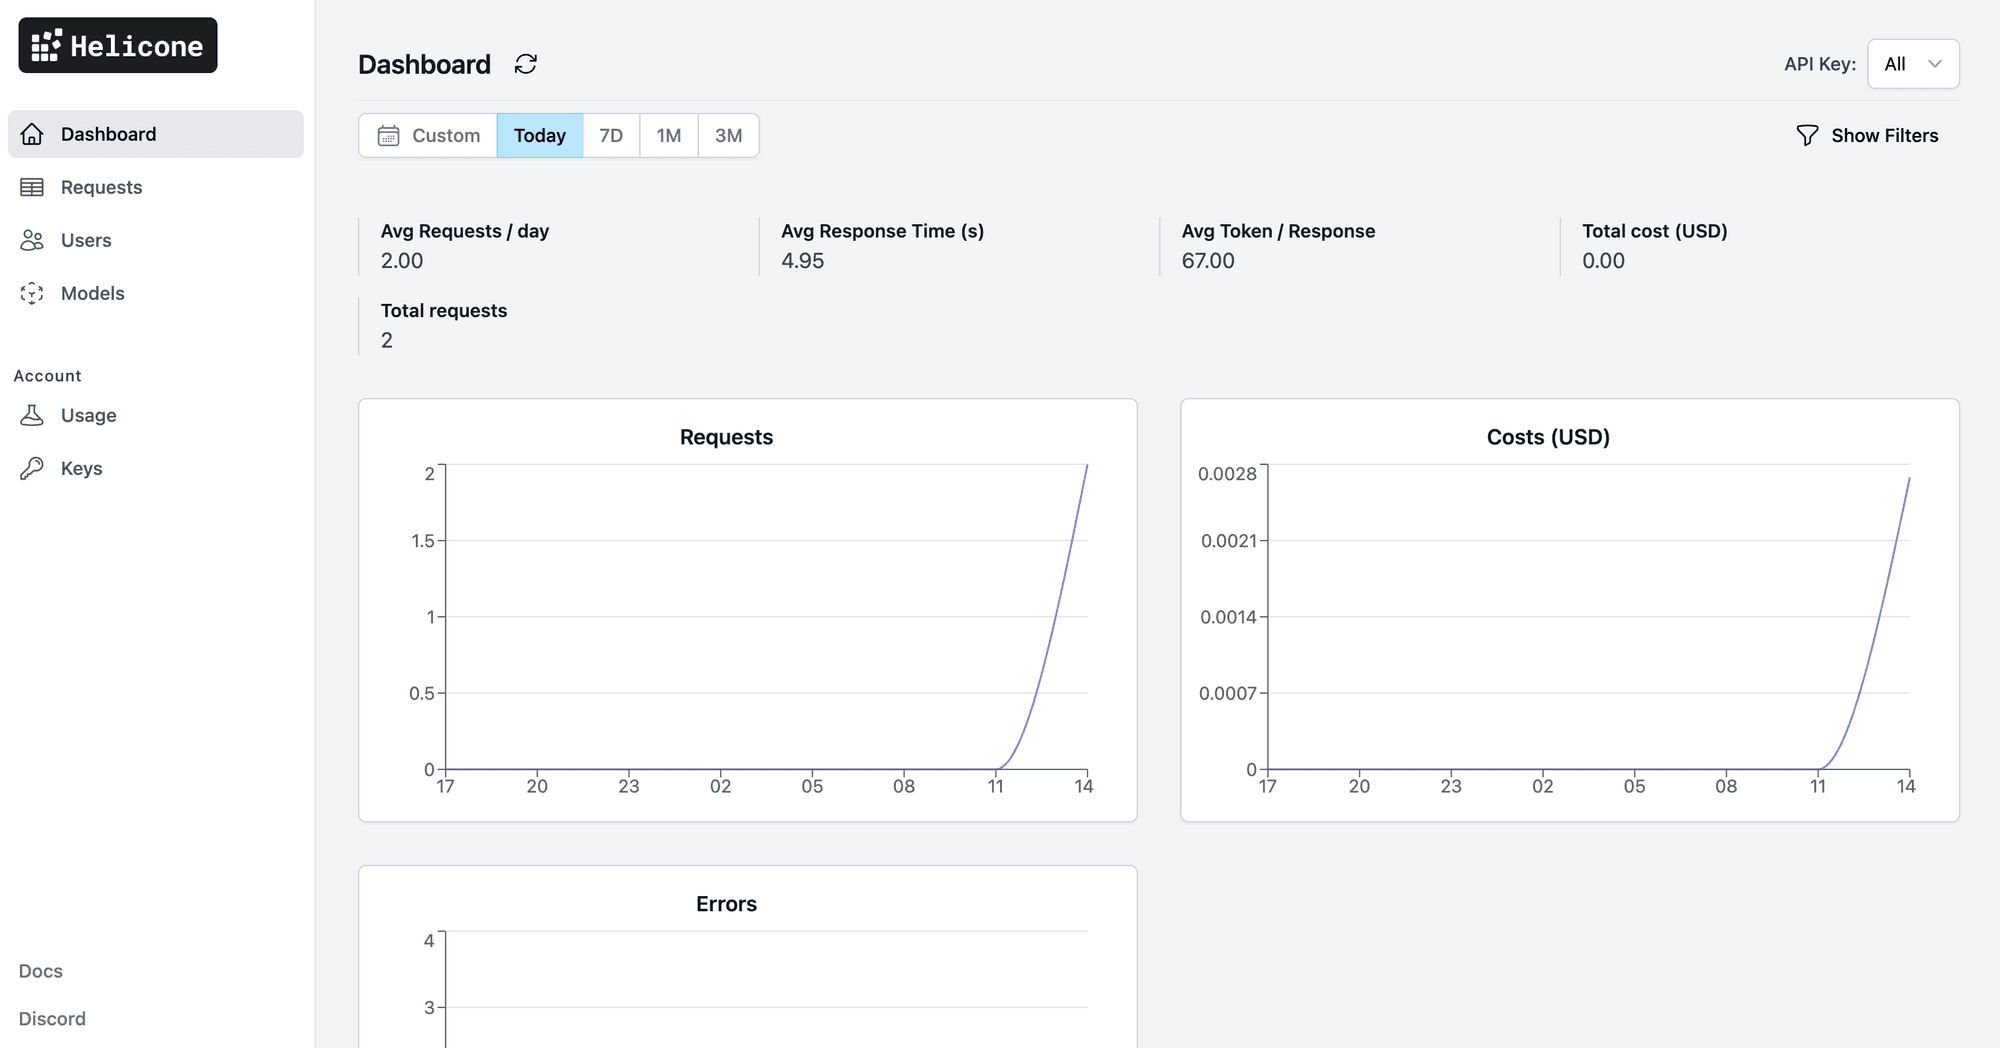
PostHog bundles LLM observability alongside product analytics, session replay, feature flags, A/B testing, and error tracking. For teams who want to understand not just how their LLM performs technically but how users actually interact with it, PostHog is uniquely positioned.
**Key Features:**
* LLM generation capture with cost, latency, and usage metrics
* Combines LLM data with product analytics funnels, retention, and user behaviour
* Session replay for AI interactions watch exactly what users experienced
* A/B testing for prompts using the same experiment framework as product features
* Prompt management (beta) with version control
* 100k LLM observability events/month on free tier
**Pros:**
* Only tool on this list that combines LLM observability with full product analytics
* Session replay for AI interactions is a uniquely powerful debugging tool
* Massive community (32k+ GitHub stars)
* Transparent, usage-based pricing
**Cons:**
* LLM-specific features (evaluation, RAG tracing) are less mature than dedicated tools
* No infrastructure monitoring pair with [OpenObserve](https://cloud.openobserve.ai/web/login?mode=signup) for complete stack coverage
* Prompt management is still in beta
**Pricing:**
* Free: 100k LLM events/month, 30-day retention
* Usage-based beyond that
**Best for:** Product-led teams who want to combine LLM monitoring with user behaviour and product analytics in one platform.
### **9\. Weave by Weights & Biases**
**License:** Apache 2.0 | **Website:** wandb.ai/site/weave
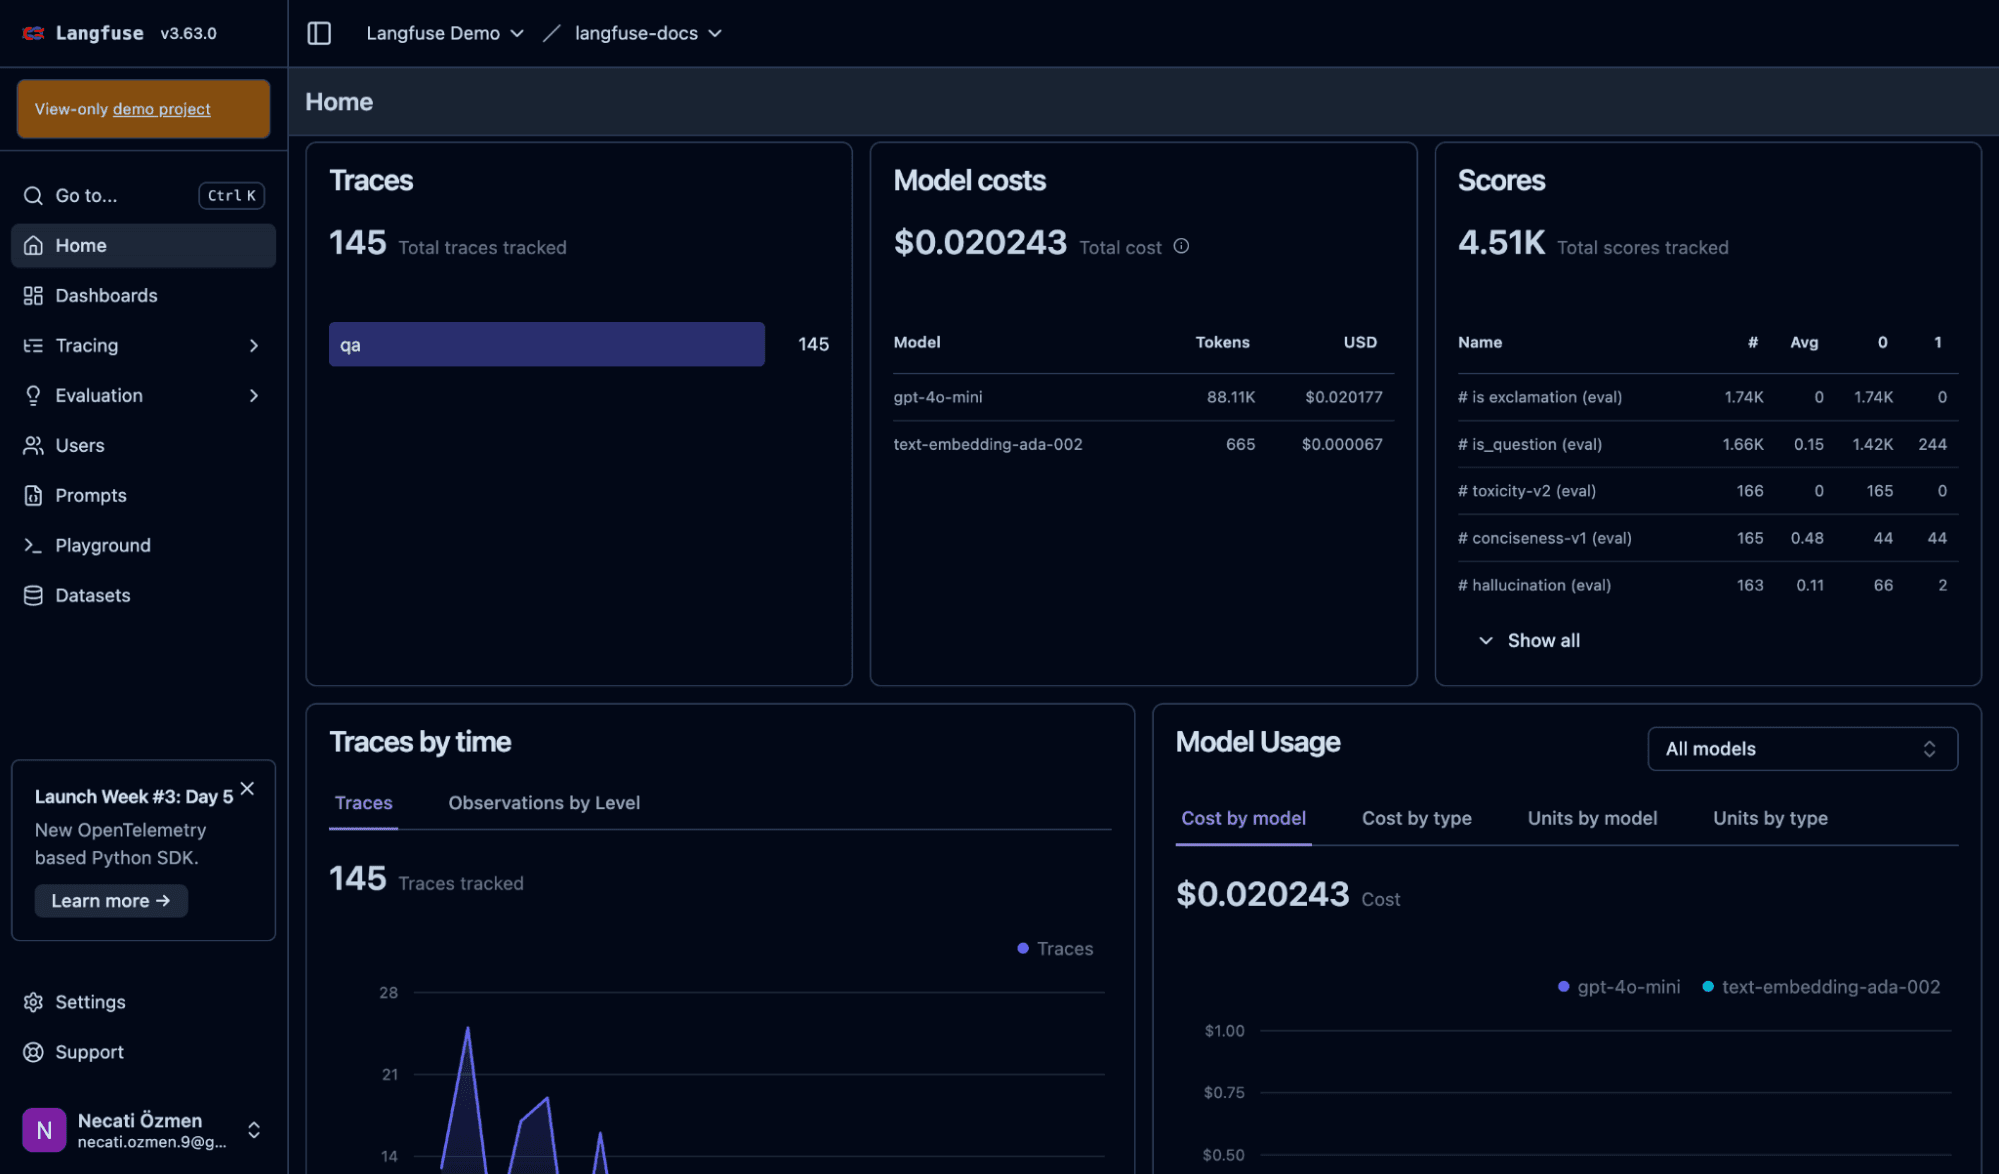
Weave is the LLM observability product from Weights & Biases (W\&B), extending W\&B's ML experiment tracking into LLM application observability covering tracing, evaluation, and dataset management in a unified interface.
**Key Features:**
* End-to-end tracing for LLM calls, chains, and agent workflows
* Dataset management with versioning for evaluation benchmarks
* Integration with W\&B experiment tracking for model-level and application-level comparison
* Human annotation tools for labelling and review workflows
* Supports Python and JavaScript
* Model-agnostic works with OpenAI, Anthropic, open source models, and custom endpoints
**Pros:**
* Natural fit for teams already using W\&B for model training and experiment tracking
* Strong dataset and evaluation management inherited from W\&B's research-grade tooling
* Apache 2.0 license commercially safe
* Bridges model development and production deployment in one workspace
**Cons:**
* Less specialized for production LLM monitoring than Langfuse or [OpenObserve](https://openobserve.ai/)
* Tightly coupled to the W\&B ecosystem less useful if you're not already a W\&B user
**Pricing:**
* Free tier available via W\&B
* Team and Enterprise plans: custom pricing
**Best for:** ML research teams already invested in the W\&B ecosystem who want to extend experiment tracking into production LLM observability.
### **10\. OpenLLMetry (Traceloop)**
**License:** Apache 2.0 | **Website:** github.com/traceloop/openllmetry
OpenLLMetry is an open source instrumentation library, not a standalone backend. Built entirely on OpenTelemetry, it wraps your LLM, vector DB, and framework calls in spans and ships them to whatever OTel-compatible backend you already run, so it pairs directly with a platform like [OpenObserve](https://openobserve.ai/) rather than replacing it.
**Key Features:**
* SDKs for Python, TypeScript, Go, and Ruby, with decorators for annotating workflows and tasks
* Instrumentation for 20+ model providers (OpenAI, Anthropic, Gemini, Bedrock, Ollama) and vector DBs (Pinecone, Chroma)
* Framework support: LangChain, LlamaIndex, CrewAI, and others
* Ships spans to any OTel-compatible backend: Datadog, Honeycomb, Grafana, [OpenObserve](https://openobserve.ai/), or a self-hosted collector
* Optional managed Traceloop platform adds dashboards and alerting on top of the same instrumentation
**Pros:**
* Pure OpenTelemetry means zero lock-in: swap or add backends without touching instrumentation code
* Fully free and open source, with active weekly commits and releases
* Broadest provider and framework coverage of any instrumentation-only library on this list
* Drops straight into an existing OTel pipeline feeding [OpenObserve](https://openobserve.ai/) for storage, querying, and alerting
**Cons:**
* Instrumentation only; it has no UI, storage, or query layer of its own, so you need a backend to send traces to
* No built-in evaluation, annotation, or prompt management; pair it with a dedicated eval tool for that
* The optional managed Traceloop platform is proprietary if you want a hosted UI without running your own backend
**Pricing:**
* Open source library: Free
* Traceloop managed platform: separate paid tiers
**Best for:** Teams that want OpenTelemetry-native instrumentation with the widest provider and framework coverage, and already have (or want) a backend like [OpenObserve](https://openobserve.ai/) to store and query the traces.
### **11\. Pydantic Logfire**
**License:** MIT (SDK, open source) | Hosted platform: proprietary | **Website:** pydantic.dev/logfire
Logfire is the observability platform from the Pydantic team, built on OpenTelemetry to trace an entire application stack, not just LLM calls, which matters for debugging whether a failure originated in the model or in surrounding application code. Its MIT-licensed SDKs (Python, TypeScript, Rust) can export to any OTel backend even without using the hosted platform.
**Key Features:**
* Purpose-built LLM views: conversation panels, token tracking, cost monitoring, and tool call inspection
* Traces the full application stack alongside LLM calls, using the same OpenTelemetry data
* Deep integration with Pydantic AI and the broader Pydantic/FastAPI ecosystem
* MIT-licensed SDKs that export to any OTel-compatible backend, not only the Logfire platform
* 10 million logs/spans/metrics per month on the free Personal plan
**Pros:**
* SDK is genuinely open source and OTel-native, so traces can be routed to [OpenObserve](https://openobserve.ai/) or another backend instead of the hosted platform
* Generous free tier (10M records/month) with no credit card required
* Tracing the whole app, not just the LLM layer, catches bugs that pure LLM-observability tools miss
* Actively developed, with commits and releases shipping continuously
**Cons:**
* The hosted platform (UI and backend) is closed source and not self-hostable; only the SDK is open
* LLM-specific views are most polished for Python and Pydantic AI; less mature for other language ecosystems
* No dedicated evaluation, annotation, or dataset workflow; it's a tracing and debugging tool first
**Pricing:**
* Free: 10M records/month
* Team: $49/month; Growth: $249/month (plus $2/million records over the included allowance)
* Enterprise: custom
**Best for:** Python and Pydantic AI teams that want OpenTelemetry-native tracing across their whole application, not just isolated LLM calls.
### **12\. Giskard**
**License:** Apache 2.0 | **Website:** github.com/Giskard-AI/giskard
Giskard is an open source evaluation and testing library focused on scanning LLM agents for vulnerabilities before and after deployment: hallucination, harmful content, prompt injection, and bias. It is a testing tool rather than a tracing backend, closer in spirit to a security scanner for LLM applications than to a dashboard.
**Key Features:**
* Automated vulnerability scanning for hallucination, harmful content, prompt injection, and bias
* RAG-specific evaluation toolkit for retrieval and grounding quality
* CI/CD integration so a vulnerability scan can gate a release the same way a unit test suite does
* Business-readable test reports alongside the raw scan output
* Framework-agnostic: works with any LLM or agent framework
**Pros:**
* Vulnerability and red-teaming-style scanning is a distinct angle from general tracing or G-Eval-style metrics
* Apache 2.0 licensed and actively maintained, with commits shipping within the last week
* CI-friendly, catching safety issues before a prompt or model change ships
* Framework-agnostic, so it doesn't lock you into a specific agent stack
**Cons:**
* Pre-deployment testing and scanning only; no tracing, dashboards, or production monitoring, pair it with a backend like [OpenObserve](https://openobserve.ai/) for that
* No prompt management or cost tracking
* Smaller community than Langfuse or [OpenObserve](https://openobserve.ai/)
**Pricing:** Free (Apache 2.0 licensed)
**Best for:** Teams that want automated vulnerability and safety scanning for LLM agents before shipping, paired with a production tracing backend for after deployment.
## **Comparison Table**
| Tool | License | Self-Hosted | Tracing | Evaluation | Prompt Mgmt | Infra Monitoring | RAG Support | Best For |
| ----- | ----- | ----- | ----- | ----- | ----- | ----- | ----- | ----- |
| [**OpenObserve**](https://openobserve.ai/) | AGPL-3.0 | ✅ | ✅ | ✅ | ⚠️ (via integrations) | ✅✅ | ✅ | Unified infra \+ LLM observability |
| **Langfuse** | MIT (core) | ✅ | ✅ | ✅ | ✅ | ❌ | ✅ | Full-lifecycle LLM observability |
| **Arize Phoenix** | ELv2 | ✅ | ✅ | ✅ | ⚠️ | ❌ | ✅✅ | RAG and agent debugging |
| **Comet Opik** | Apache 2.0 | ✅ | ✅ | ✅ | ✅ | ❌ | ✅ | Prompt optimization \+ observability |
| **Confident AI** | Commercial | ⚠️ (Enterprise only) | ✅ | ✅✅ (online and offline) | ✅ | ❌ | ✅ | Eval-first, OTel-native LLM/agent observability |
| **Lunary** | Apache 2.0 | ✅ | ✅ | ⚠️ | ❌ | ❌ | ✅ | JavaScript RAG & chatbots |
| **TruLens** | MIT | ✅ | ⚠️ | ✅✅ | ❌ | ❌ | ✅ | Structured evaluation pipelines |
| **PostHog** | MIT | ✅ | ✅ | ⚠️ | ⚠️ (beta) | ❌ | ⚠️ | LLM \+ product analytics combined |
| **Weave (W\&B)** | Apache 2.0 | ✅ | ✅ | ✅ | ⚠️ | ❌ | ✅ | ML research teams on W\&B |
| **OpenLLMetry** | Apache 2.0 | ✅ | ✅✅ | ❌ | ❌ | ❌ | ✅ | OTel instrumentation for any backend |
| **Pydantic Logfire** | MIT (SDK) / proprietary platform | ⚠️ (SDK only) | ✅ | ⚠️ | ❌ | ✅ | ⚠️ | Python/Pydantic AI full-stack tracing |
| **Giskard** | Apache 2.0 | ✅ | ❌ | ✅✅ | ❌ | ❌ | ✅ | Pre-deployment vulnerability scanning |
*✅ \= strong support, ✅✅ \= best-in-class, ⚠️ \= partial or in beta, ❌ \= not available*
## **How Do You Choose the Right LLM Observability Tool?**
### **1\. Start with your deployment requirement**
If your organization requires data residency or strict compliance, every tool on this list supports self-hosting. For the simplest and most powerful self-hosted path, [**OpenObserve**](https://openobserve.ai/) stands out single binary deployment in under 2 minutes, covering both infrastructure and LLM telemetry with no multi-component stack to manage. For pure LLM-specific self-hosting, **Langfuse** via Docker Compose takes about 5 minutes.
### **2\. Match the tool to your primary bottleneck**
| If your main problem is... | Best tool(s) |
| ----- | ----- |
| Unified infra \+ LLM observability in one place | [OpenObserve](https://openobserve.ai/) |
| Debugging agent and chain failures | [OpenObserve](https://openobserve.ai/), Langfuse, Arize Phoenix |
| RAG pipeline quality | Arize Phoenix, TruLens, Lunary |
| Prompt quality and optimization | Comet Opik, Langfuse |
| Cost and token tracking | Langfuse, [OpenObserve](https://cloud.openobserve.ai/web/login?mode=signup) |
| Storage cost at scale | [OpenObserve](https://openobserve.ai/) (columnar compression; approx. 140x vs Elasticsearch in typical workloads) |
| Pre-deployment unit testing in CI | Confident AI's DeepEval |
| Continuous production scoring, no second tool | [OpenObserve](https://openobserve.ai/) Online Evaluations |
| JavaScript/Node.js first | Lunary, PostHog |
| Product analytics \+ LLM | PostHog |
### **3\. Consider your framework dependencies**
* **LangChain / LangGraph users:** Langfuse has the deepest native LLM-specific integration; route infrastructure telemetry to [OpenObserve](https://openobserve.ai/) for full-stack visibility
* **LlamaIndex users:** TruLens and Arize Phoenix have strong LlamaIndex support
* **OpenAI SDK / Anthropic SDK users:** All tools support this; [OpenObserve](https://openobserve.ai/) is the most scalable long-term combination for teams that also want infrastructure telemetry in the same store
* **Custom stacks / framework agnostic:** Instrument directly with the OpenTelemetry SDK and export straight to [OpenObserve](https://cloud.openobserve.ai/web/login?mode=signup), the safest, most future-proof combination since neither layer locks you into a proprietary format
### **4\. Think about the evaluation maturity you need**
In early development, basic tracing and cost monitoring (Lunary) may be enough. Before shipping, **Confident AI**'s open source DeepEval framework catches quality regressions in CI with a Pytest-style workflow, free to run locally. In production, **Langfuse** and **Arize Phoenix** lead for comprehensive evaluation workflows; **TruLens** leads for structured RAG evaluation methodology; and [**OpenObserve**](https://openobserve.ai/) Online Evaluations scores live traffic continuously at span, trace, or session scope without a second platform. For teams wanting a single backend for all telemetry while layering eval tools on top, [**OpenObserve**](https://openobserve.ai/) is the ideal foundation.
### **5\. Factor in long-term lock-in risk**
Tools built on OpenTelemetry standards particularly **Arize Phoenix** and [**OpenObserve**](https://openobserve.ai/) give you the most flexibility to change components without re-instrumenting your application. [OpenObserve](https://openobserve.ai/) is fully OTEL-native, meaning your instrumentation code stays unchanged regardless of which evaluation or prompt management layer you place on top.
**Related guides:**
- [Top 10 LLM Observability Tools in 2026](https://openobserve.ai/blog/top-10-llm-observability-tools/) (including commercial platforms like Datadog, Arize AI, and LangSmith)
- [Top 10 Observability Tools in 2026](https://openobserve.ai/blog/top-10-observability-tools/)
- [Top 10 Open Source Observability Tools in 2026](https://openobserve.ai/blog/top-10-open-source-observability-tools/)
- [Top 10 AIOps Platforms in 2026](https://openobserve.ai/blog/top-10-aiops-platforms/)
- [Best Log Management Tools in 2026](https://openobserve.ai/blog/log-management-tools/)
- [Top 10 Datadog Competitors in 2026](https://openobserve.ai/blog/datadog-competitors/)